English
  Русский
 Bahasa Indonesia
 Bahasa Malay
 ไทย
ไทย Español
 Deutsch
 Български
 Français
 Tiếng Việt
 中文
中文 বাংলা
বাংলা हिन्दी
 Čeština
 Українська
 Română

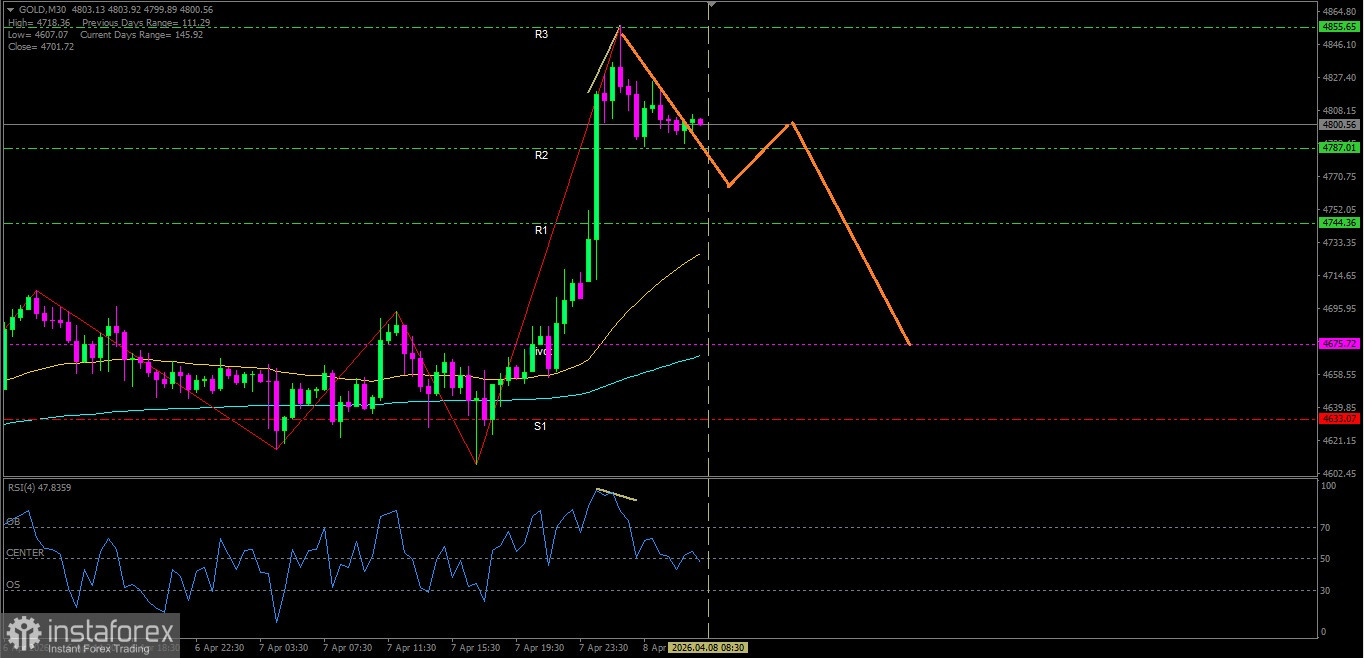
[Gold]
With the appearance of a Bearish Divergence between RSI with price movement, then there is potential for gold to weaken again and fall towards its nearest support level
Key Levels
1. Resistance. 2 : 4787.01
2. Resistance. 1 : 4744.36
3. Pivot : 4675.72
4. Support. 1 : 4633.07
5. Support. 2 : 4564.43
Tactical Scenario
Pressure Zone: If the price breaks below 4787.01, there is potential pressure on Gold towards 4744.36.
Momentum Extension Bias: If 4744.36 is successfully broken below, Gold has the potential to move towards 4675.72.
Invalidation Level / Bias Revision
Downside bias is maintained if the Gold price strengthens and breaks above 4855.65.
Technical Summary
EMA(50) : 4724.47
EMA(200): 4667.76
RSI(14) : 54.73
Economic News Release Agenda:
The following economic data will be released from the United States:
US - Crude Oil Inventories - 21:30 WIB
US - 10-y Bond Auction - 00:01 WIB
US - FOMC Meeting Minutes - 01:00 WIB