English
  Русский
 Bahasa Indonesia
 Bahasa Malay
 ไทย
ไทย Español
 Deutsch
 Български
 Français
 Tiếng Việt
 中文
中文 বাংলা
বাংলা हिन्दी
 Čeština
 Українська
 Română

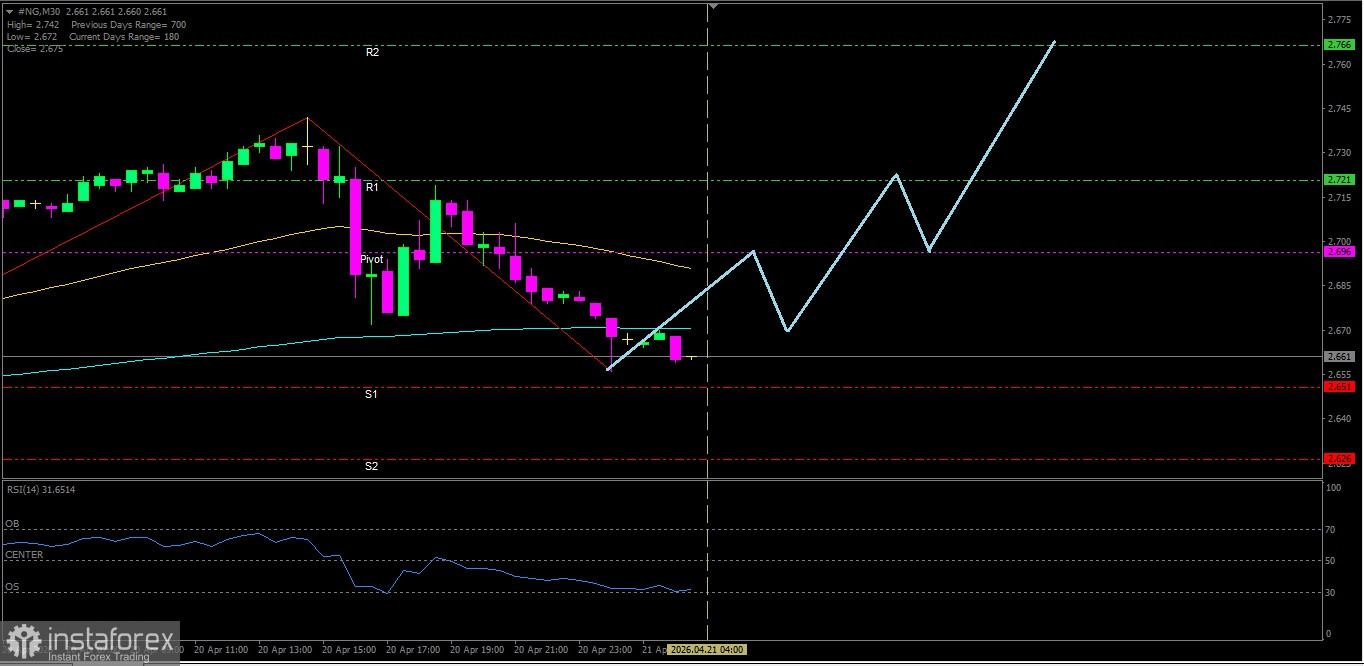
Natural Gas
With a Golden Cross condition on both EMAs, then today #NG has the potential to test its nearest resistance level.
Key Levels
1. Resistance. 2 : 2.766
2. Resistance. 1 : 2.721
3. Pivot : 2.696
4. Support. 1 : 2.651
5. Support. 2 : 2.626
Tactical Scenario
Positive Reaction Zone: If the price breaks out above 2.696, there is potential to move up toward 2.721.
Momentum Extension Bias: If 2.721 is broken to the upside, #NG may test 2.766.
Invalidation Level / Bias Revision
The upside bias weakens when price falls below 84.40.
Technical Summary
EMA(50) : 2.692
EMA(200): 2.671
RSI(14) : 30.70
Economic News Release Agenda:
Today the United States will release the following economic data:
US - ADP Weekly Employment Change - 19:15 WIB
US - Core Retail Sales m/m - 19:30 WIB
US - Retail Sales m/m - 19:30 WIB
US - Pending Home Sales m/m - 21:00 WIB
US - Business Inventories m/m - 21:00 WIB
US - API Weekly Statistical Bulletin - 03:30 WIB