 English
  Русский
 Bahasa Indonesia
 Bahasa Malay
 ไทย
ไทย Español
 Deutsch
 Български
 Français
 Tiếng Việt
 中文
中文 বাংলা
বাংলা हिन्दी
 Čeština
 Українська
 Română

Trade Review and Advice for Trading the Japanese Yen
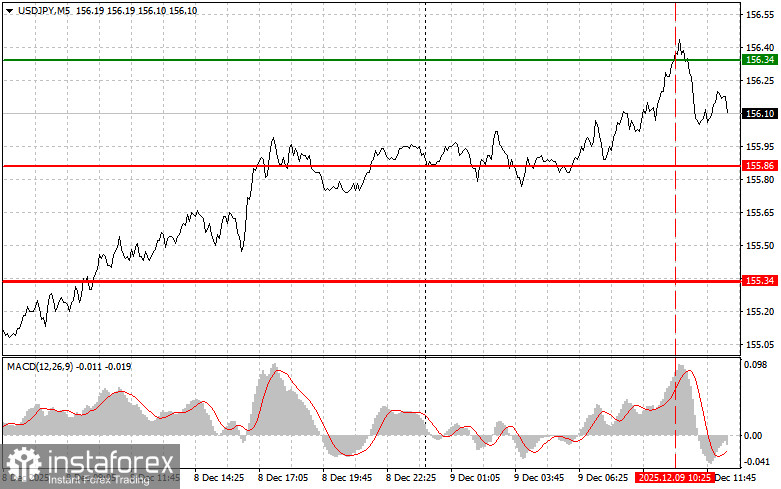
The test of the 156.34 price occurred when the MACD indicator had already moved far above the zero line, which limited the pair's upward potential. For this reason, I did not buy the dollar.
The dollar continued to gain against the yen for the third consecutive day, despite the Bank of Japan seemingly planning to raise interest rates, while the U.S. Federal Reserve is expected to lower them. However, since this scenario has been anticipated since the end of last month, there is nothing surprising in the upward correction of the USD/JPY pair.
Later today, attention will focus on the ADP weekly employment change report, which is considered a leading indicator ahead of the official U.S. Department of Labor employment data. However, it's important to consider methodological differences between ADP and the Department of Labor, treating ADP data as indicative rather than exact—especially given their high volatility due to the short period.
Additionally, the JOLTS report from the U.S. Bureau of Labor Statistics will be released, providing a more detailed picture of the labor market. It includes data on job openings, hires, layoffs, and voluntary quits. A high number of job openings can signal a shortage of qualified personnel and indicate that companies are confident in growth, actively expanding their workforce. Overall, strong data may trigger another wave of USD/JPY gains.
For intraday strategy, I will primarily rely on Scenarios #1 and #2.
Buy Signal
Scenario #1: I plan to buy USD/JPY today upon reaching the entry point around 156.25 (green line on the chart), targeting a rise to 156.73 (thicker green line). Near 156.73, I will exit long positions and open shorts in the opposite direction (expecting a 30–35-point move). A rise in the pair today can be expected only after strong U.S. data. Important! Before buying, ensure the MACD indicator is above zero and just beginning to rise from it.
Scenario #2: I also plan to buy USD/JPY today if there are two consecutive tests of 155.96 while the MACD is in the oversold zone. This will limit the pair's downward potential and trigger a reversal upward. A rise toward 156.25 and 156.73 can be expected.
Sell Signal
Scenario #1: I plan to sell USD/JPY today after the 155.96 level is broken (red line on the chart), which should lead to a rapid decline. The key target for sellers will be 155.50, where I will exit shorts and immediately open longs in the opposite direction (expecting a 20–25-point rebound). Pressure on the pair will return only if U.S. data are very weak. Important! Before selling, ensure the MACD is below zero and just beginning to decline from it.
Scenario #2: I also plan to sell USD/JPY today if there are two consecutive tests of 156.25 while the MACD is in the overbought zone. This will limit the pair's upward potential and trigger a reversal downward. A decline toward 155.96 and 155.50 can be expected.
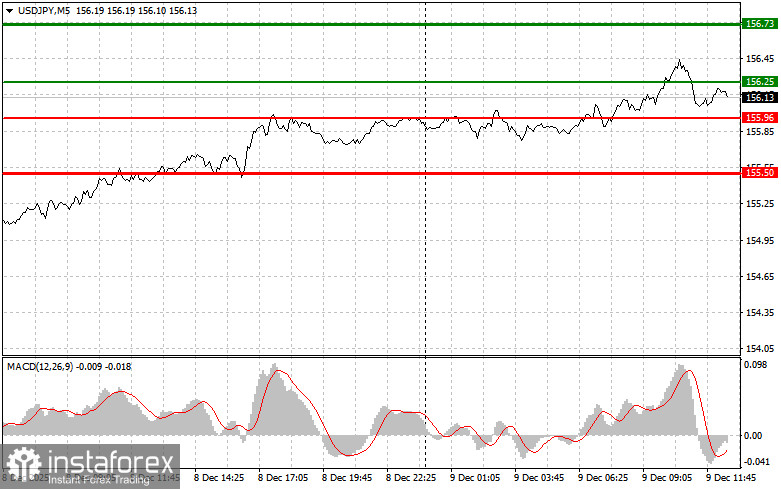
Chart Notes
- Thin green line – entry price for buying the trading instrument.
- Thick green line – suggested level for placing Take Profit or manually taking profits, as further growth above this level is unlikely.
- Thin red line – entry price for selling the trading instrument.
- Thick red line – suggested level for placing Take Profit or manually taking profits, as further decline below this level is unlikely.
- MACD indicator – when entering the market, rely on overbought and oversold zones.
Important
Beginner Forex traders must be extremely cautious when entering the market. Before major fundamental reports, it's best to stay out of the market to avoid sharp price swings. If you choose to trade during news releases, always set stop orders to minimize losses. Without stop orders, you can quickly lose your entire deposit, especially if you ignore money management and trade large volumes.
Remember: successful trading requires a clear trading plan like the one provided above. Making spontaneous decisions based solely on current market conditions is inherently a losing strategy for intraday traders.