 English
 Русский
 Bahasa Indonesia
 Bahasa Malay
 ไทย
ไทย Español
 Deutsch
 Български
 Français
 Tiếng Việt
 中文
中文 বাংলা
বাংলা हिन्दी
 Čeština
 Українська
 Română


Trade review for Tuesday:
1H chart of the GBP/USD pair
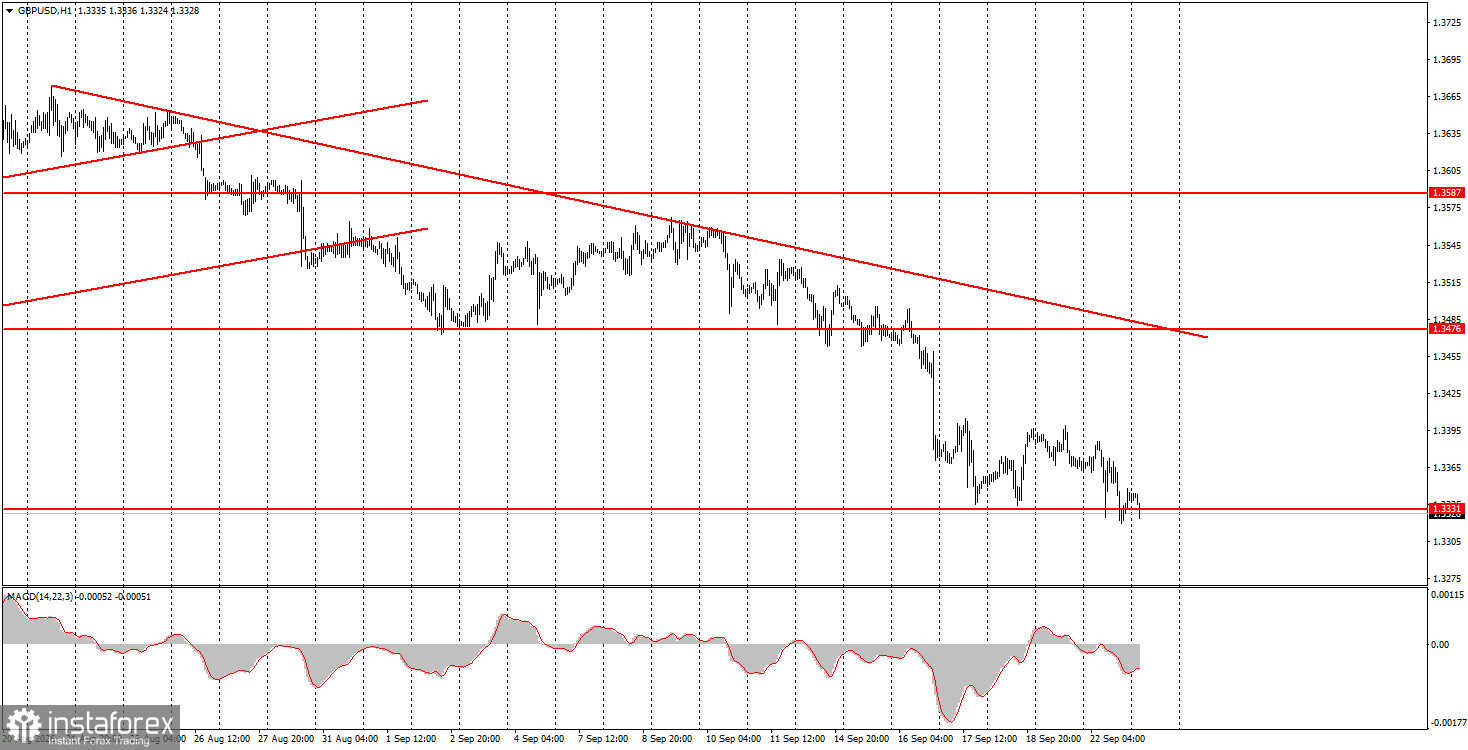
The GBP/USD pair resumed its downward move on Tuesday within the existing downtrend. As we have said, there were no new fundamental reasons for further US-dollar strength, yet the market continues to buy the dollar. This behavior has persisted for three weeks now; the only defensible explanation remains Federal Reserve-policy expectations. Other explanations are mostly technical or inertia-driven. The market may buy the dollar because it has been rising strongly for the past two months — a thin rationale, in our view. We do not believe the dollar has solid justification to rally for two months straight, but markets do what they will. Thus, the practical approach is to trade with the trend amid low volatility. This week's macro calendar is light, but traders are still selling the pair.
5M chart of the GBP/USD pair
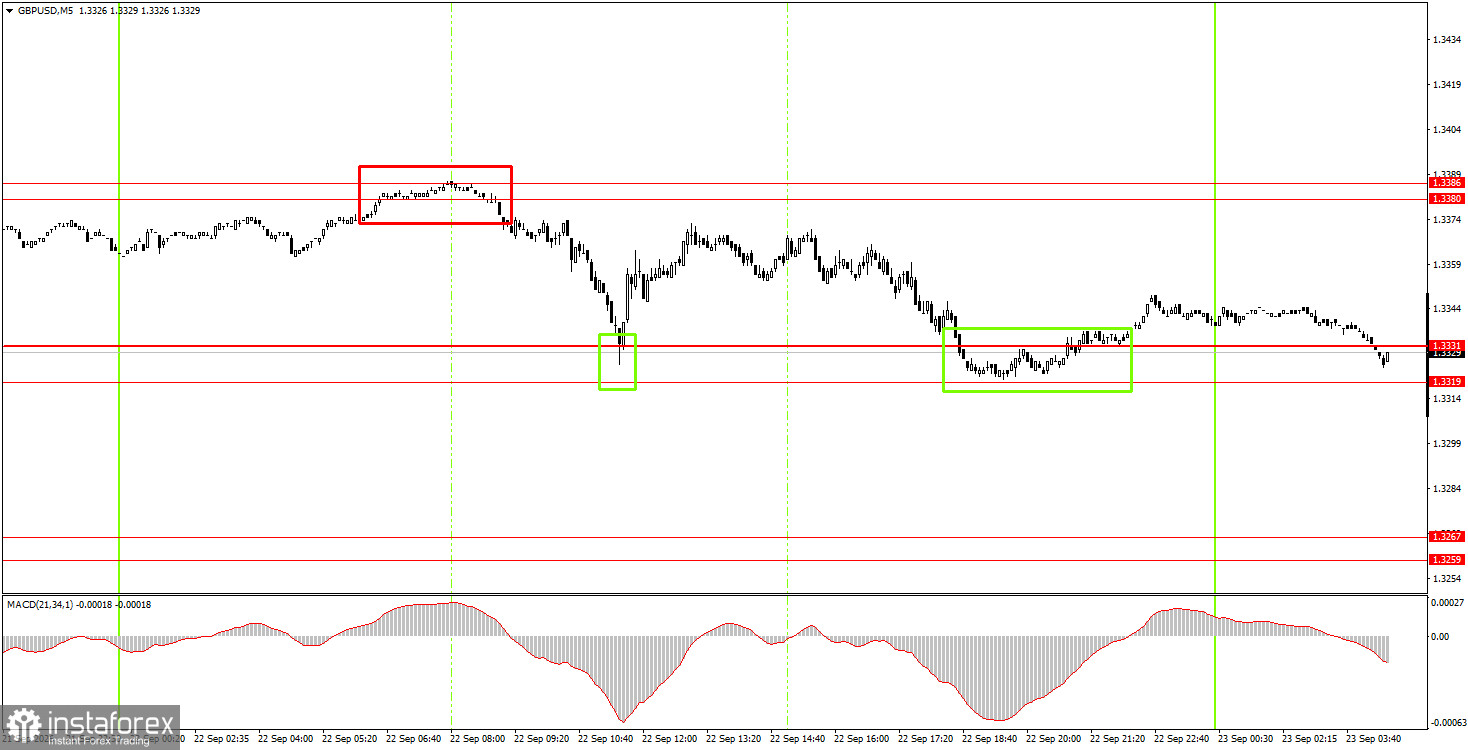
On the 5-minute timeframe on Tuesday, three trading signals formed. Price first bounced from the 1.3380–1.3386 area and dropped toward 1.3319–1.3331. Two bounces from that zone provided opportunities to open long positions, but in both cases the near targets were not reached. The first short trade, however, was profitable.
How to trade on Wednesday:
On the hourly timeframe, the GBP/USD pair continues a downward trend that has become a full-blown trend. The fundamental backdrop for the dollar and the pound shifted sharply last week as the Fed signaled it was ready to continue tightening. As a result, the dollar's outlook for the second half of 2026 looks materially more favorable again. However, the dollar lacks other strong supporting factors.
On Wednesday, novice traders may consider short positions targeting 1.3259–1.3267 if price consolidates below the 1.3319–1.3331 area. Open long positions targeting 1.3380–1.3386 if price bounces from the 1.3319–1.3331 zone.
On the 5-minute timeframe, you can trade the levels 1.3259–1.3267, 1.3319–1.3331, 1.3380–1.3386, 1.3456–1.3476, 1.3587–1.3598, 1.3631–1.3641, 1.3695, 1.3741. On Wednesday, the UK and the US will publish business-activity indices for services and manufacturing. Note that US ISM indices carry greater market weight; still, watch the UK releases today.
Key Rules of the Trading System:
- The strength of a signal is determined by the time it takes to form the signal (rebound or breakout). The less time taken, the stronger the signal.
- If two or more trades were opened at a certain level based on false signals, all subsequent signals from that level should be ignored.
- In a range (flat), any pair can generate many false signals or may not produce any at all. Technical levels may be disregarded.
- On the hourly timeframe, trading signals from the MACD indicator should be acted upon only when volatility is high, and a trend line or trend channel confirms the trend.
- If two levels are too close together (within 5-20 pips), treat them as a support or resistance area.
- After moving 15 pips in the right direction, a stop-loss should be set to break even.
What to Look for on the Charts:
Price levels (areas) of support and resistance serve as targets for opening buy or sell trades or as sources of signals.
Red lines indicate channels or trend lines that show the current trend and the preferred trading direction.
The MACD indicator (14,22,3) — the histogram and signal line — is an auxiliary indicator that can also provide signals.
Important speeches and reports (listed in the news calendar) can significantly influence currency pair movements. Therefore, during their release, traders should approach trading with utmost caution, or exit the market to avoid sudden reversals against the preceding move.
Beginner forex traders should remember that not every trade can be profitable. Developing a clear strategy and practicing money management are key to long-term success in trading.