 English
 Русский
 Bahasa Indonesia
 Bahasa Malay
 ไทย
ไทย Español
 Deutsch
 Български
 Français
 Tiếng Việt
 中文
中文 বাংলা
বাংলা हिन्दी
 Čeština
 Українська
 Română


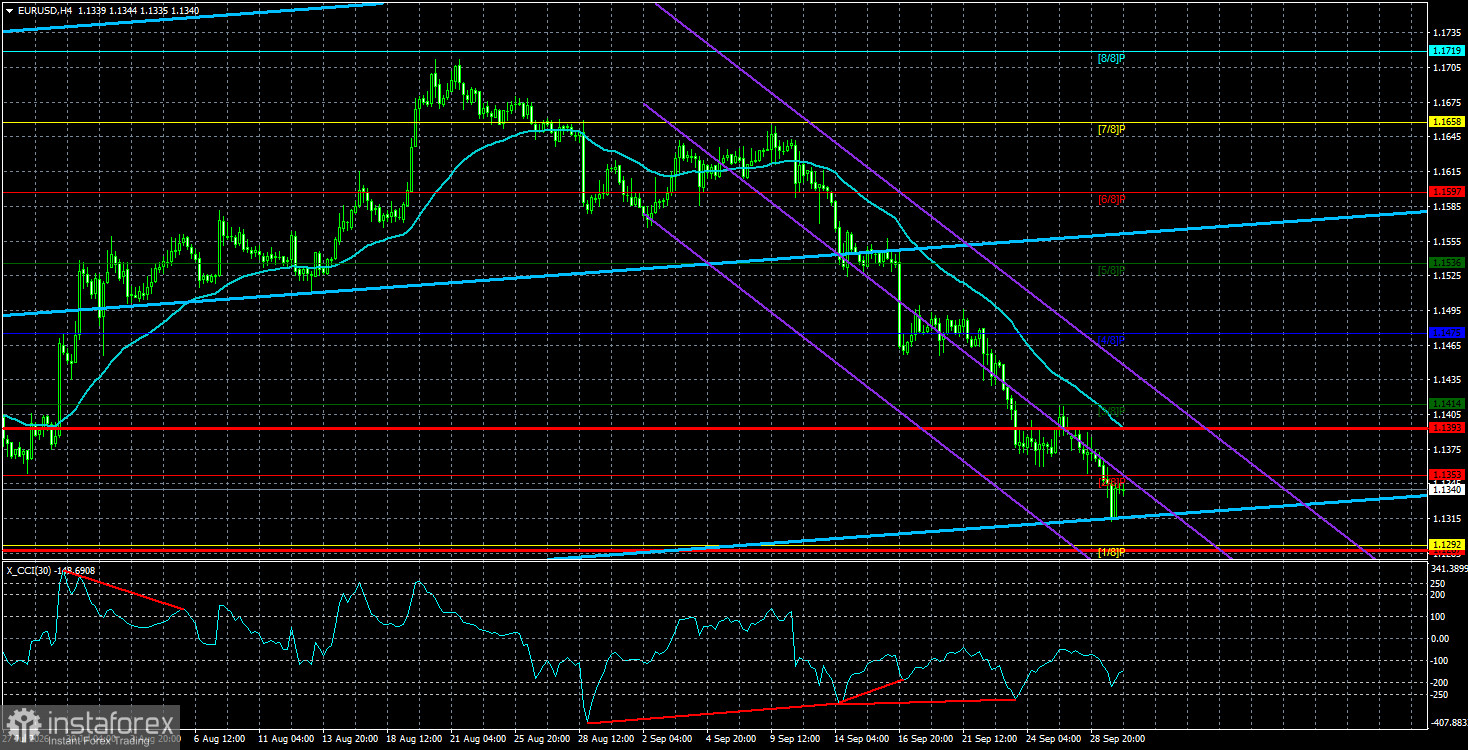
The EUR/USD pair continued to fall on Tuesday — what else would you expect? The market is so eager and hungry for further Federal Reserve tightening that it keeps buying the dollar even weeks after that factor has already been worked through. Recall the last time you saw an almost month-long, almost uninterrupted move driven by a single factor. Other drivers are scarce right now. Every market participant tries to explain September's euro collapse in their own way. Some point to rising geopolitical instability, some point only to the Fed's hawkish tilt, some say the European Central Bank is not hawkish enough — even though in practice the ECB might raise rates as much as or more than the Fed. In short, every trader and analyst has an opinion. And no one asks why there are so many opinions.
Many opinions exist because the dollar's current rise is ambiguous and illogical. If the situation were clear, everyone would share one view. For example, in September 2022 the US currency began its four-year downtrend, starting with a 1,400-pip drop. What preceded that decline? First, a 16-year uptrend that began in 2007, during which the dollar moved from about $1.60 to roughly $0.96 per euro — in other words, the euro's value roughly halved by 2022. Note that we're talking about a reserve currency that central banks worldwide hold alongside the dollar, not some emerging-market currency.
So in September 2022 this all began as a simple correction. Since we're looking at the long term, 500 pips of the 1,400 could easily be profit-taking. Around the same time, US inflation began to decelerate, and the market started to expect Fed easing. The Fed was still hiking then, but the dollar fell because the market anticipated easing — the tightening had already been largely priced in during 2021–2022, when the dollar rose about 2,700 pips. Consequently, the euro rallied some 1,400 pips on global factors.
And now? The euro has been falling for the fourth week in a row because... both the ECB and the Fed started tightening? On the weekly timeframe, the long-term uptrend from 2022 still holds, and a year-long trading range persists. The price has only fallen to yearly lows, so one can argue we're seeing liquidity being removed from recent lows within an almost sideways channel rather than an ongoing structural collapse. Our view remains unchanged. Within a range, moves tend to be essentially random. The euro has no grounds for a sustained collapse, and the dollar has no grounds for a sustained long-term advance. Therefore, any long-term dollar rise is by definition a correction, after which the primary trend should resume. Admittedly, we did not expect the correction to stretch out for a full year, but for the weekly timeframe such a correction period is entirely normal.
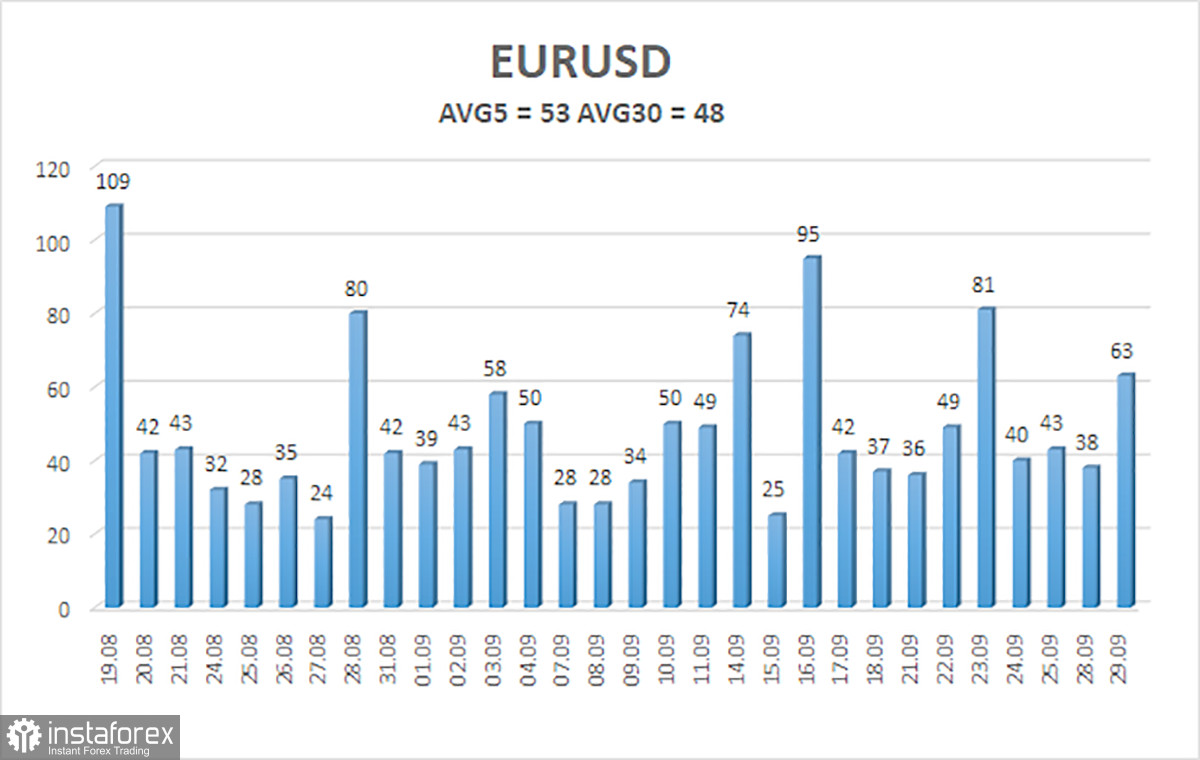
The average volatility of the EUR/USD currency pair over the last 5 trading days as of September 30 is 53 pips and is characterized as "average." We expect the pair to move between 1.1287 and 1.1393 on Wednesday. The higher linear-regression channel is pointing upward, indicating an uptrend. The CCI indicator entered the oversold area three times and formed three "bullish" divergences, which warn of the end of the illogical downward trend. However, the market is not reacting to anything right now.
Nearest support levels:
S1 – 1.1292
S2 – 1.1230
S3 – 1.1169
Nearest resistance levels:
R1 – 1.1353
R2 – 1.1414
R3 – 1.1475
Trading Recommendations:
The EUR/USD pair continues to move downward, but we still view the decline as a correction before a new upward trend. The global fundamental backdrop for the dollar remains negative, but in 2026, geopolitics first, and then the Fed's hawkish stance, provided strong support to the US currency. When price is below the moving average, consider short positions with targets of 1.1292 and 1.1230. Above the moving average, long positions are relevant, with targets of 1.1475 and 1.1536.
Explanations for Illustrations:
Regression channels help determine the current trend. If both are directed in the same direction, it means the trend is currently strong;
The moving average line (settings 20,0, smoothed) defines the short-term trend and the direction in which trading should be conducted at present;
Murray levels are target levels for moves and corrections;
Volatility levels (red lines) are the probable price channel within which the pair will spend the next 24 hours based on current volatility indicators;
The CCI indicator – its entry into the oversold area (below -250) or the overbought area (above +250) indicates that a trend reversal in the opposite direction is approaching.