 English

 Русский
 Bahasa Indonesia
 Bahasa Malay
 ไทย
 Español
 Deutsch
 Български
 Français
 Tiếng Việt
 中文
 বাংলা
 हिन्दी
 Čeština
 Українська
 Română



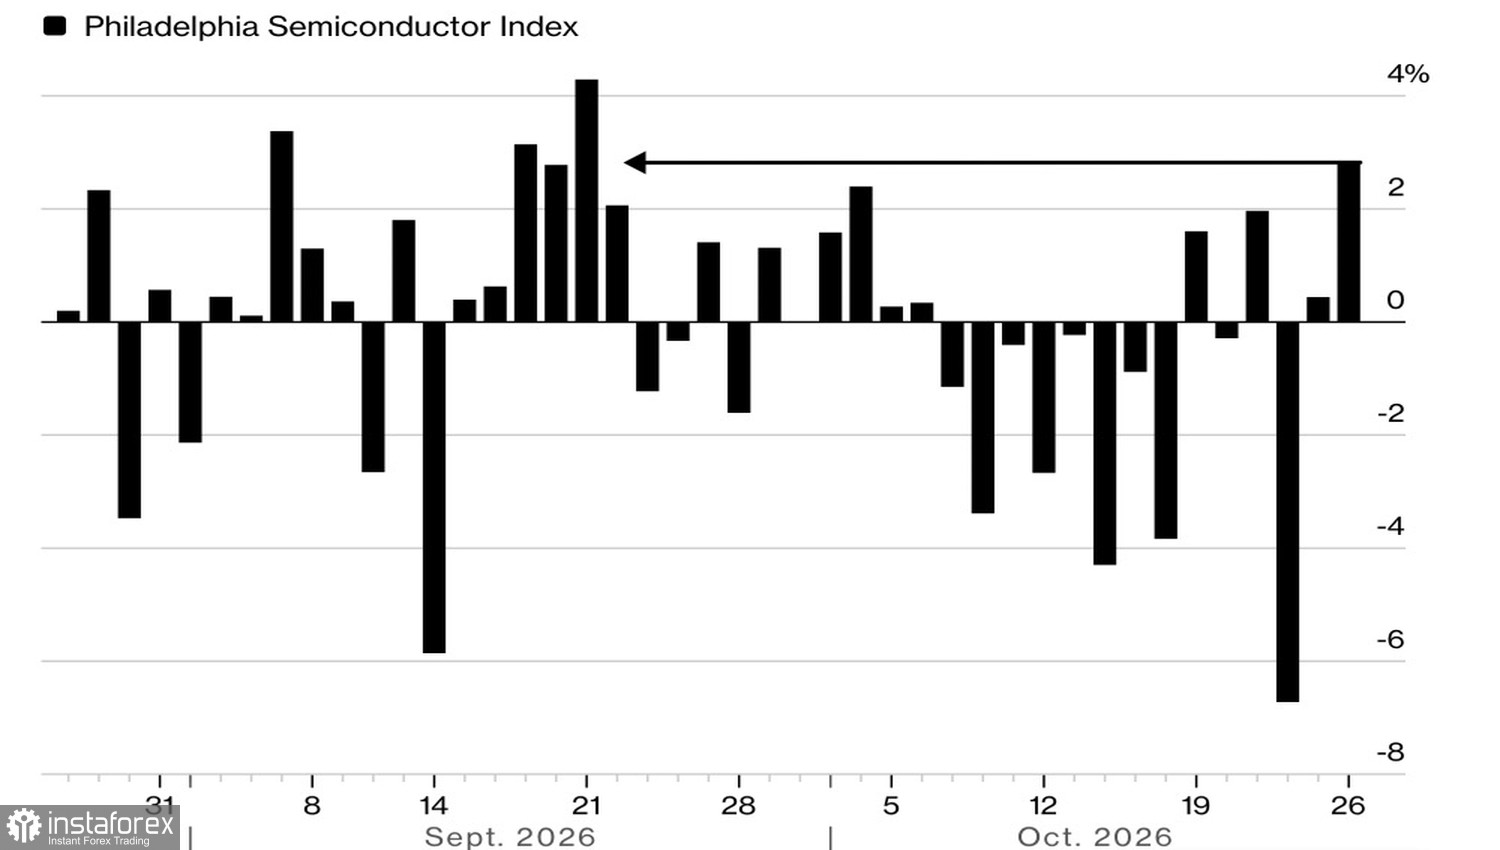
The market had been torn by worries over AI, and Anthropic's S-1 filing helped damp some of those fears. The S&P 500 posted its first close in the green in three days, and the Philadelphia Semiconductor Index posted its best showing in a month. Has interest in AI really returned?
Philadelphia Semiconductor Index dynamics
Investors had feared Anthropic might be so loss-making that its IPO would be seen as a distress move. In fact, revenue at the Claude maker surged to $16.3 billion in H1 2026, versus $1.2 billion in Jan-Jun 2025. Equally important for the market was Anthropic's cash position: $112.4 billion in cash and equivalents — the company has raised roughly 80% of the liquidity over six years — plus another $19.3 billion in short-term securities.
That balance sheet looked reassuring to investors and, combined with news that tech giants are sustaining or expanding capex, gave the S&P 500 a lift. Meta said it expects to raise up to $97.5 billion via common and preferred share offerings. Broadcom arranged about $63 billion in financing to buy chips. SpaceX signed equipment lease deals for about $40 billion. Fears that AI investment would be cut back appear to have been overstated, at least for now.
New risks can still emerge. Anthropic warned that costs to reengineer its models could spike if courts rule that parts of the technology violate intellectual property law. And a Democratic "blue wave" in the midterms would increase the risk of a pullback in the S&P 500.
Markets and bonds outlook after primaries
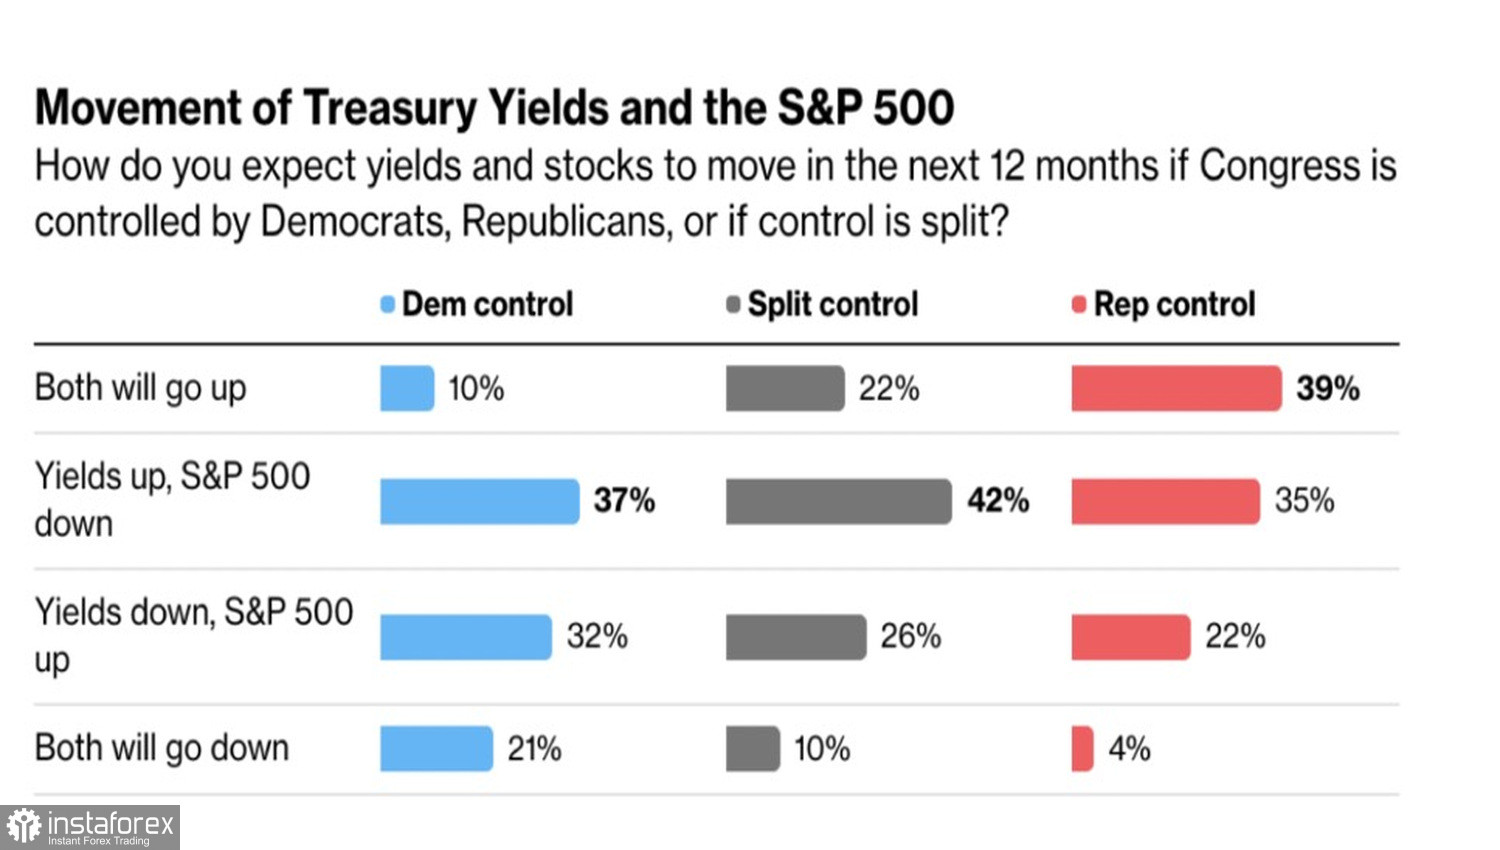
A Bloomberg poll shows that 58% of respondents expect a blue-wave outcome to pressure the broad index over the next 12 months. Conversely, 60% say a Republican victory would lift the S&P 500, arguing that Democrats would resist deregulation and tax cuts — policies that typically accelerate growth and favor US equities.
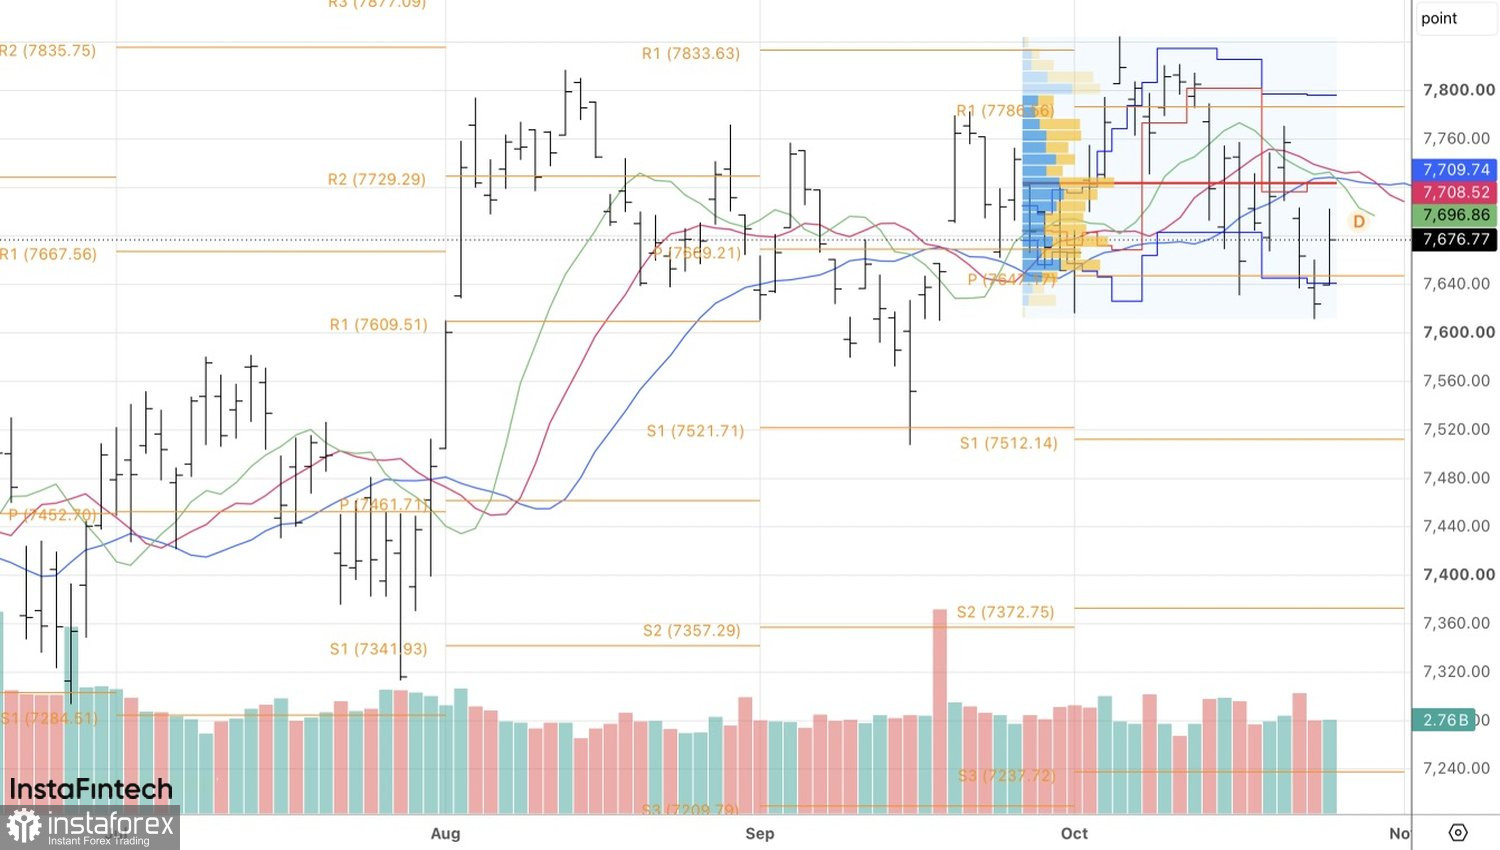
But the S&P 500 faces tests before the primaries. Markets are pricing in a Fed hold at the October 27–28 meeting, yet hawkish language from Chair Kevin Warsh, including hints that policy could tighten in December, could push Treasury yields back up and hit the equity market.
Technically, the daily S&P 500 chart shows a bar combination resembling an inverted hammer. A move back above 7,700 would support new long entries, while a drop below 7,645 would be a sell signal.