 English

 Русский
 Bahasa Indonesia
 Bahasa Malay
 ไทย
 Español
 Deutsch
 Български
 Français
 Tiếng Việt
 中文
 বাংলা
 हिन्दी
 Čeština
 Українська
 Română


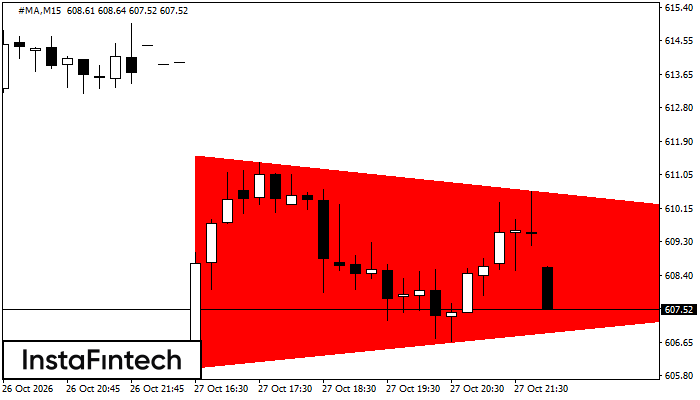 The Bearish Symmetrical Triangle pattern has formed on the #MA M15 chart. Its lower boundary passes through 606.00/608.68, while its upper boundary passes through 611.55/608.68. The pattern width is 555 points. The Bearish Symmetrical Triangle indicates a likely continuation of the downtrend. If #MA breaks below the lower boundary, the price could move toward 608.46.
The M5 and M15 time frames may generate more false entry signals.