 English
  Русский
 Bahasa Indonesia
 Bahasa Malay
 ไทย
ไทย Español
 Deutsch
 Български
 Français
 Tiếng Việt
 中文
中文 বাংলা
বাংলা हिन्दी
 Čeština
 Українська
 Română
FX.co ★ Actual patterns. Technical analysis and trading recommendations

Technical Analysis Patterns
There is nothing more precious to a trader than an ability to predict a further price movement. Technical analysis is a key to your successful transaction. At the same time, you can rely on common and recurring situations that arise in the same circumstances. Our Technical Analysis Patterns section features all trading recommendations based on the technical analysis patterns that help traders make projections and turn a profit.
Instrument:
1 selected
#Bitcoin
EURCHF
EURGBP
EURJPY
EURUSD
EURCAD
EURRUB
EURNZD
USDCAD
USDCHF
USDJPY
USDRUB
NZDCAD
NZDUSD
NZDCHF
NZDJPY
AUDCAD
AUDCHF
AUDJPY
AUDUSD
GBPUSD
GBPJPY
GBPAUD
GBPCHF
GOLD
SILVER
#AAPL
#AMZN
#EBAY
#FB
#GOOG
#MCD
#MA
#KO
#INTC
#MSFT
#NTDOY
#PEP
#TSLA
#TWTR
Figure:
All
Triangle
Rectangle
Pennant
Flag
Head and Shoulders
Double Top
Triple top
Timeframe:
All
M5
M15
M30
H1
D1
Signal strength:
All
High
Medium
Low
Signal direction:
All
Buy
Sell
#Bitcoin
#Bitcoin M5
Double Top
The Double Top pattern has been formed on #Bitcoin M5. It signals that the trend has been changed from upwards to downwards. Probably, if the base of the pattern 63892.99 is broken, the downward movement will continue.
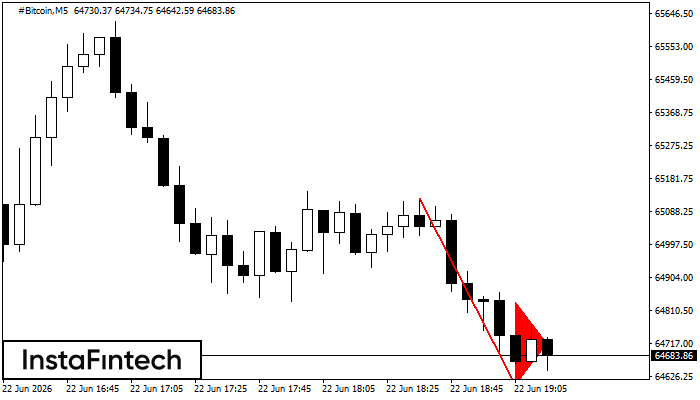
#Bitcoin M5
Bearish pennant
The Bearish pennant pattern has formed on the #Bitcoin M5 chart. It signals potential continuation of the existing trend. Specifications: the pattern’s bottom has the coordinate of 64600.75; the projection of the flagpole height is equal to 52568 pips. In case the price breaks out the pattern’s bottom of 64600.75, the downtrend is expected to continue for further level 64600.60.
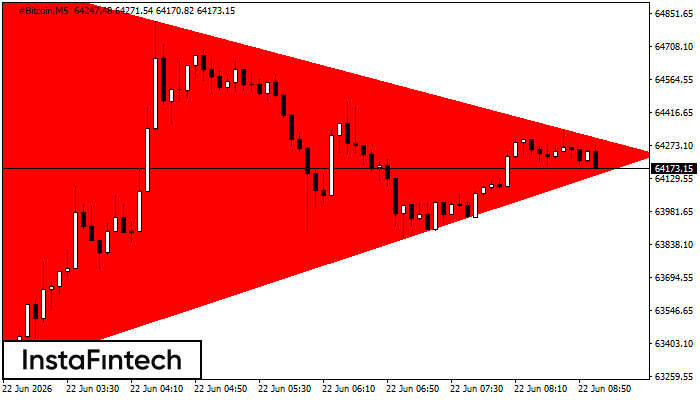
#Bitcoin M5
Bearish Symmetrical Triangle
According to the chart of M5, #Bitcoin formed the Bearish Symmetrical Triangle pattern. Trading recommendations: A breach of the lower border 63271.90 is likely to encourage a continuation of the downward trend.
#Bitcoin M5
Bearish Symmetrical Triangle
According to the chart of M5, #Bitcoin formed the Bearish Symmetrical Triangle pattern. This pattern signals a further downward trend in case the lower border 63271.90 is breached. Here, a hypothetical profit will equal the width of the available pattern that is -184437 pips.
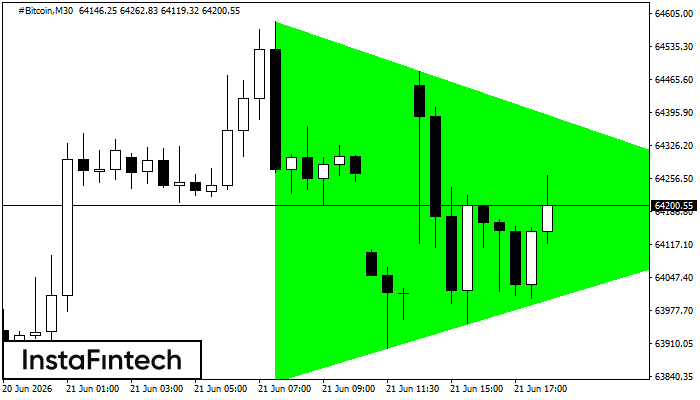
#Bitcoin M30
Bullish Symmetrical Triangle
According to the chart of M30, #Bitcoin formed the Bullish Symmetrical Triangle pattern. Description: This is the pattern of a trend continuation. 64588.18 and 63826.66 are the coordinates of the upper and lower borders respectively. The pattern width is measured on the chart at 76152 pips. Outlook: If the upper border 64588.18 is broken, the price is likely to continue its move by 64183.82.
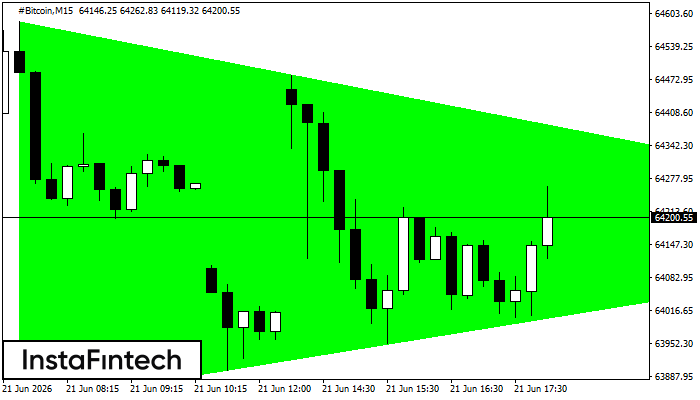
#Bitcoin M15
Bullish Symmetrical Triangle
According to the chart of M15, #Bitcoin formed the Bullish Symmetrical Triangle pattern, which signals the trend will continue. Description. The upper border of the pattern touches the coordinates 64588.18/64175.55 whereas the lower border goes across 63831.85/64175.55. The pattern width is measured on the chart at 75633 pips. If the Bullish Symmetrical Triangle pattern is in progress during the upward trend, this indicates the current trend will go on. In case 64175.55 is broken, the price could continue its move toward 64175.77.
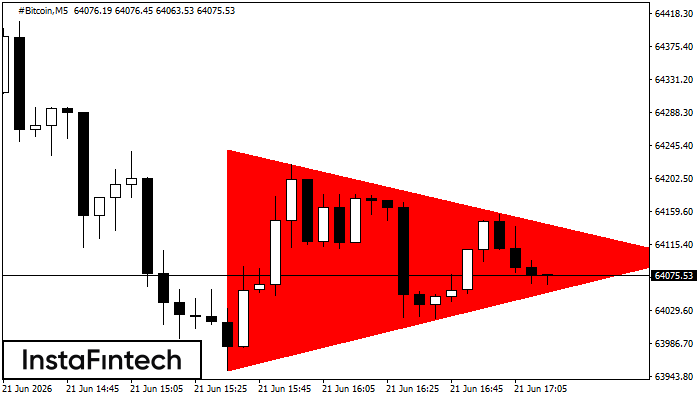
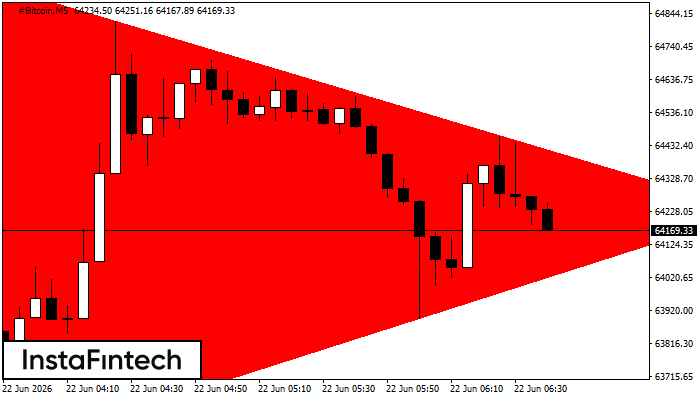
#Bitcoin M5
Bearish Symmetrical Triangle
According to the chart of M5, #Bitcoin formed the Bearish Symmetrical Triangle pattern. Description: The lower border is 63951.36/64098.19 and upper border is 64240.38/64098.19. The pattern width is measured on the chart at -28902 pips. The formation of the Bearish Symmetrical Triangle pattern evidently signals a continuation of the downward trend. In other words, if the scenario comes true and #Bitcoin breaches the lower border, the price could continue its move toward 64098.04.
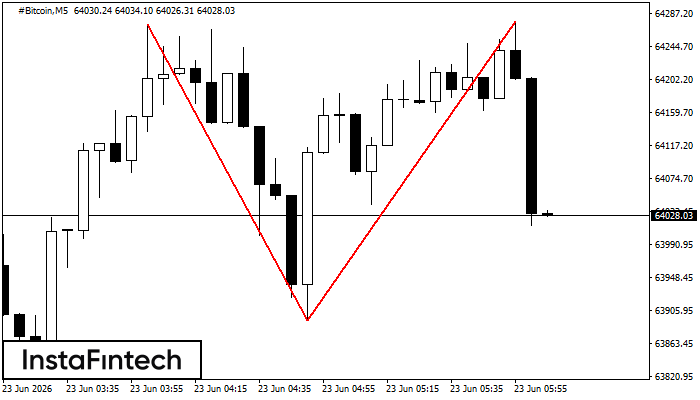
#Bitcoin M5
Double Bottom
The Double Bottom pattern has been formed on #Bitcoin M5; the upper boundary is 64588.18; the lower boundary is 64224.95. The width of the pattern is 36937 points. In case of a break of the upper boundary 64588.18, a change in the trend can be predicted where the width of the pattern will coincide with the distance to a possible take profit level.
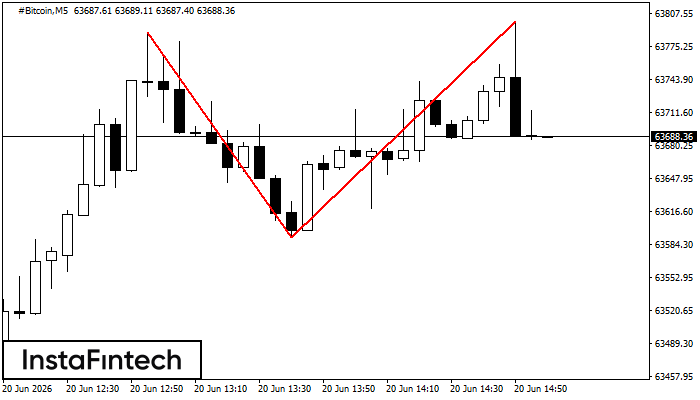
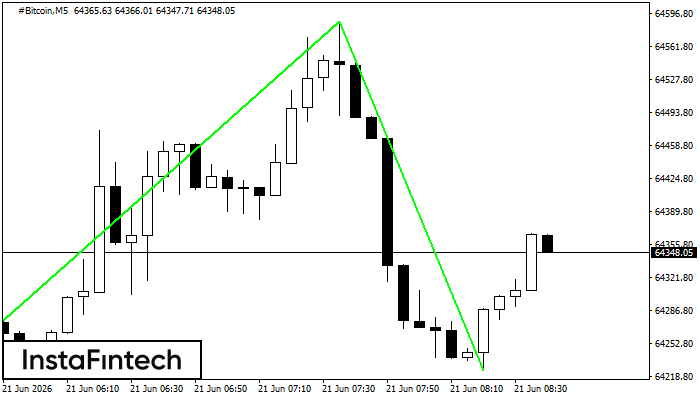
#Bitcoin M5
Double Top
On the chart of #Bitcoin M5 the Double Top reversal pattern has been formed. Characteristics: the upper boundary 63799.59; the lower boundary 63591.71; the width of the pattern 20788 points. The signal: a break of the lower boundary will cause continuation of the downward trend targeting the 63591.56 level.
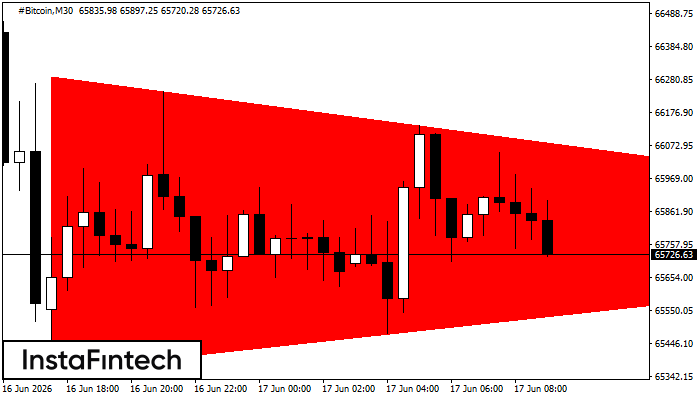
#Bitcoin M30
Bearish Symmetrical Triangle
According to the chart of M30, #Bitcoin formed the Bearish Symmetrical Triangle pattern. Trading recommendations: A breach of the lower border 65360.39 is likely to encourage a continuation of the downward trend.