 Français
  Русский
 English
 Bahasa Indonesia
 Bahasa Malay
 ไทย
ไทย Español
 Deutsch
 Български
 Tiếng Việt
 中文
中文 বাংলা
বাংলা हिन्दी
 Čeština
 Українська
 Română
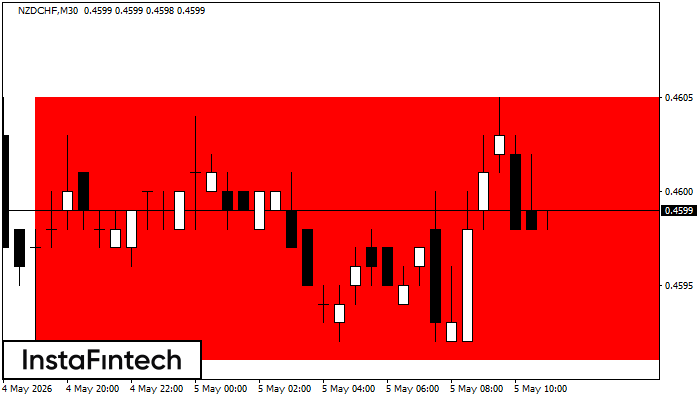 According to the chart of M30, NZDCHF formed the Bearish Rectangle. The pattern indicates a trend continuation. The upper border is 0.4605, the lower border is 0.4591. The signal means that a short position should be opened after fixing a price below the lower border 0.4591 of the Bearish Rectangle.
 FX.co ★ NZDCHF M30: Bearish Rectangle
Signal strength 3 of 5
NZDCHF M30: Bearish Rectangle
According to the chart of M30, NZDCHF formed the Bearish Rectangle. The pattern indicates a trend continuation. The upper border is 0.4605, the lower border is 0.4591. The signal means that a short position should be opened after fixing a price below the lower border 0.4591 of the Bearish Rectangle. *L'analyse de marché présentée est de nature informative et n'est pas une incitation à effectuer une transaction