 Français
  Русский
 English
 Bahasa Indonesia
 Bahasa Malay
 ไทย
ไทย Español
 Deutsch
 Български
 Tiếng Việt
 中文
中文 বাংলা
বাংলা हिन्दी
 Čeština
 Українська
 Română
FX.co ★ Modèles réels. Analyse technique et recommandations de trading

Modèles d'analyse technique
There is nothing more precious to a trader than an ability to predict a further price movement. Technical analysis is a key to your successful transaction. At the same time, you can rely on common and recurring situations that arise in the same circumstances. Our Technical Analysis Patterns section features all trading recommendations based on the technical analysis patterns that help traders make projections and turn a profit.
Outil:
1 sélectionné
#Bitcoin
EURCHF
EURGBP
EURJPY
EURUSD
EURCAD
EURRUB
EURNZD
USDCAD
USDCHF
USDJPY
USDRUB
NZDCAD
NZDUSD
NZDCHF
NZDJPY
AUDCAD
AUDCHF
AUDJPY
AUDUSD
GBPUSD
GBPJPY
GBPAUD
GBPCHF
GOLD
SILVER
#AAPL
#AMZN
#EBAY
#FB
#GOOG
#MCD
#MA
#KO
#INTC
#MSFT
#NTDOY
#PEP
#TSLA
#TWTR
Figure:
All
Triangle
Rectangle
Pennant
Flag
Head and Shoulders
Double Top
Triple top
Timeframe:
All
M5
M15
M30
H1
D1
Signal strength:
All
High
Medium
Low
Signal direction:
All
Buy
Sell
GBPAUD
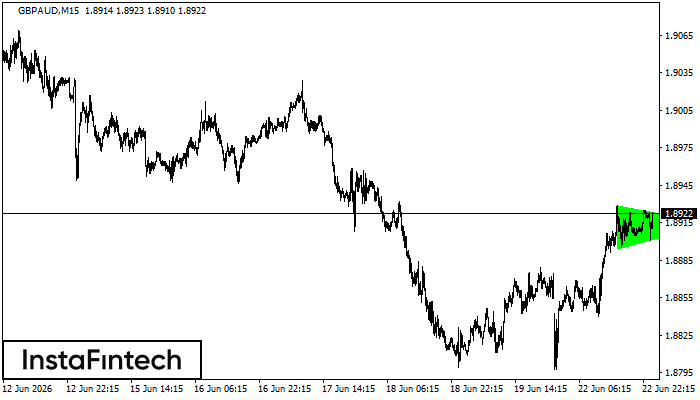
GBPAUD M15
Bullish Symmetrical Triangle
According to the chart of M15, GBPAUD formed the Bullish Symmetrical Triangle pattern. The lower border of the pattern touches the coordinates 1.8894/1.8914 whereas the upper border goes across 1.8929/1.8914. If the Bullish Symmetrical Triangle pattern is in progress, this evidently signals a further upward trend. In other words, in case the scenario comes true, the price of GBPAUD will breach the upper border to head for 1.8937.
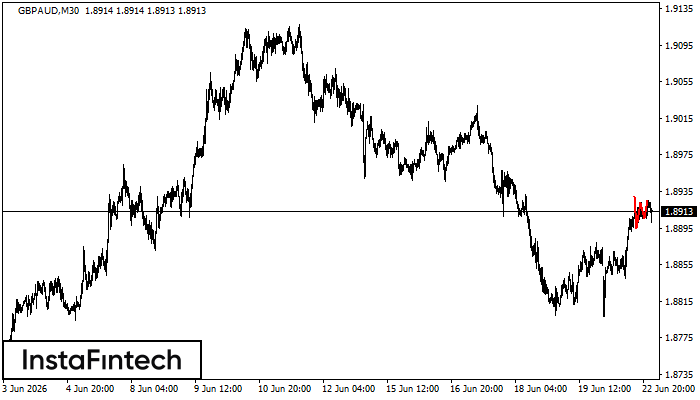
GBPAUD M30
Triple Top
The Triple Top pattern has formed on the chart of the GBPAUD M30 trading instrument. It is a reversal pattern featuring the following characteristics: resistance level 4, support level -10, and pattern’s width 34. Forecast If the price breaks through the support level 1.8895, it is likely to move further down to 1.8893.
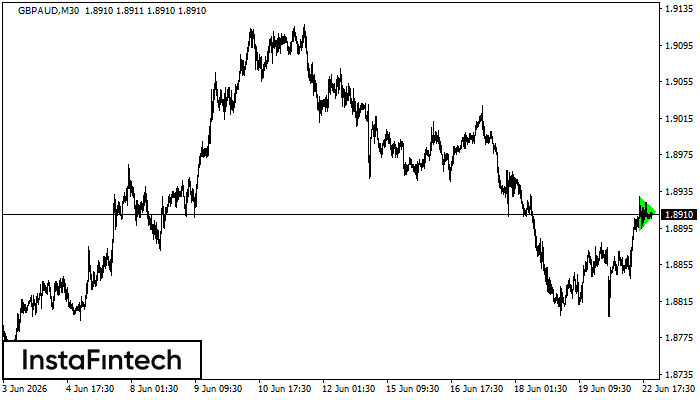
GBPAUD M30
Bullish Symmetrical Triangle
According to the chart of M30, GBPAUD formed the Bullish Symmetrical Triangle pattern. The lower border of the pattern touches the coordinates 1.8893/1.8913 whereas the upper border goes across 1.8929/1.8913. If the Bullish Symmetrical Triangle pattern is in progress, this evidently signals a further upward trend. In other words, in case the scenario comes true, the price of GBPAUD will breach the upper border to head for 1.8943.
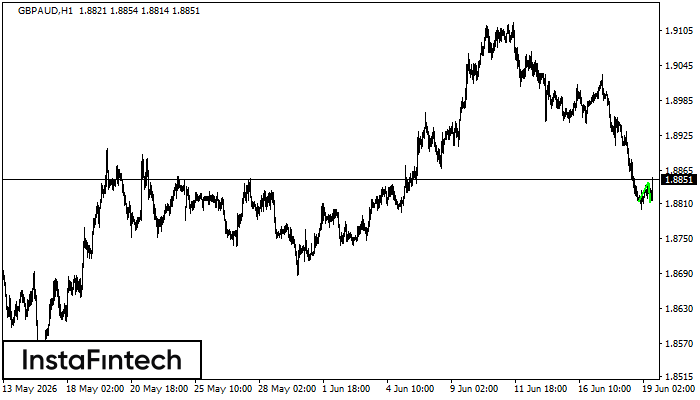
GBPAUD H1
Double Bottom
The Double Bottom pattern has been formed on GBPAUD H1. Characteristics: the support level 1.8813; the resistance level 1.8846; the width of the pattern 33 points. If the resistance level is broken, a change in the trend can be predicted with the first target point lying at the distance of 35 points.
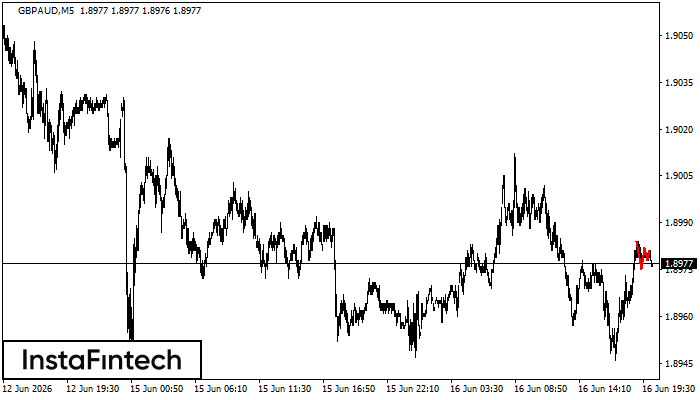
GBPAUD M5
Double Top
The Double Top pattern has been formed on GBPAUD M5. It signals that the trend has been changed from upwards to downwards. Probably, if the base of the pattern 1.8978 is broken, the downward movement will continue.
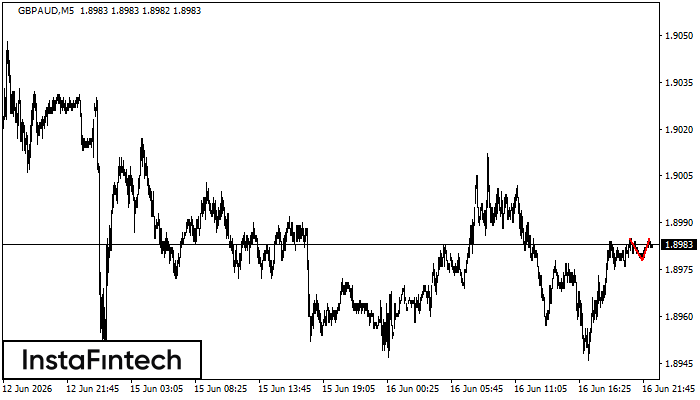
GBPAUD M5
Triple Top
The Triple Top pattern has formed on the chart of the GBPAUD M5 trading instrument. It is a reversal pattern featuring the following characteristics: resistance level 3, support level -3, and pattern’s width 9. Forecast If the price breaks through the support level 1.8975, it is likely to move further down to 1.8967.
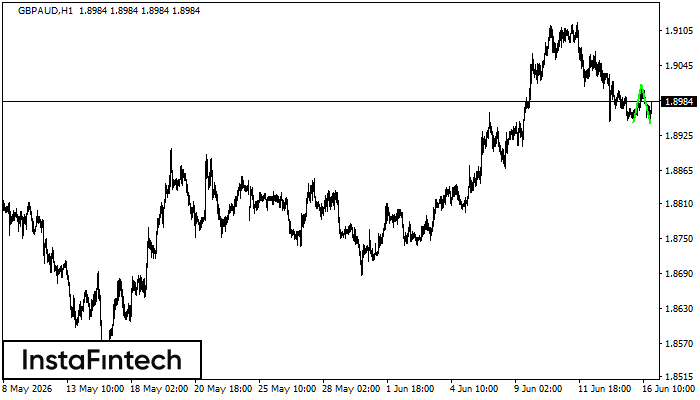
GBPAUD H1
Double Bottom
The Double Bottom pattern has been formed on GBPAUD H1; the upper boundary is 1.9012; the lower boundary is 1.8946. The width of the pattern is 65 points. In case of a break of the upper boundary 1.9012, a change in the trend can be predicted where the width of the pattern will coincide with the distance to a possible take profit level.
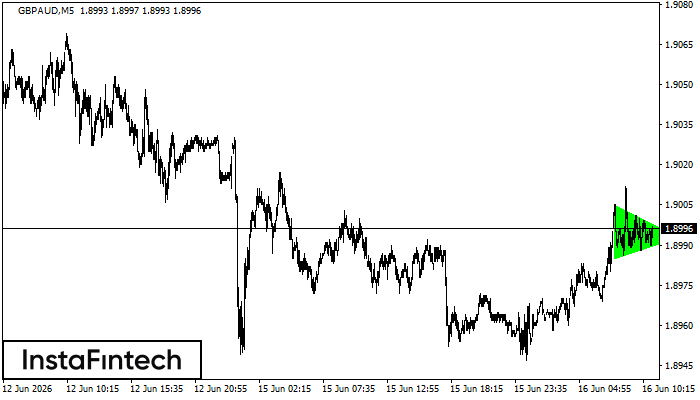
GBPAUD M5
Bullish Symmetrical Triangle
According to the chart of M5, GBPAUD formed the Bullish Symmetrical Triangle pattern. The lower border of the pattern touches the coordinates 1.8985/1.8993 whereas the upper border goes across 1.9005/1.8993. If the Bullish Symmetrical Triangle pattern is in progress, this evidently signals a further upward trend. In other words, in case the scenario comes true, the price of GBPAUD will breach the upper border to head for 1.9008.
GBPAUD M5
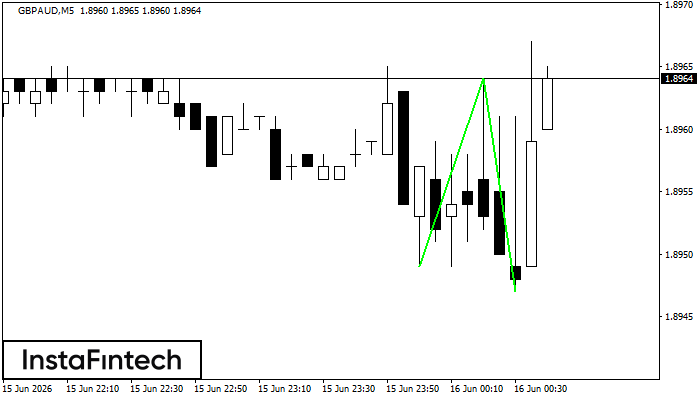
Double Bottom
The Double Bottom pattern has been formed on GBPAUD M5; the upper boundary is 1.8964; the lower boundary is 1.8947. The width of the pattern is 15 points. In case of a break of the upper boundary 1.8964, a change in the trend can be predicted where the width of the pattern will coincide with the distance to a possible take profit level.
GBPAUD M5
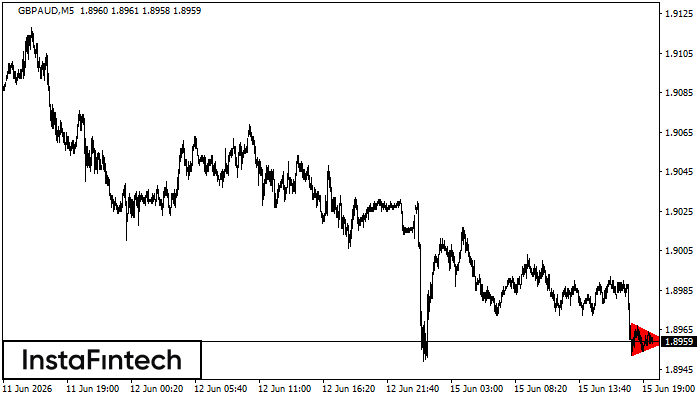
Bearish Symmetrical Triangle
According to the chart of M5, GBPAUD formed the Bearish Symmetrical Triangle pattern. Trading recommendations: A breach of the lower border 1.8952 is likely to encourage a continuation of the downward trend.