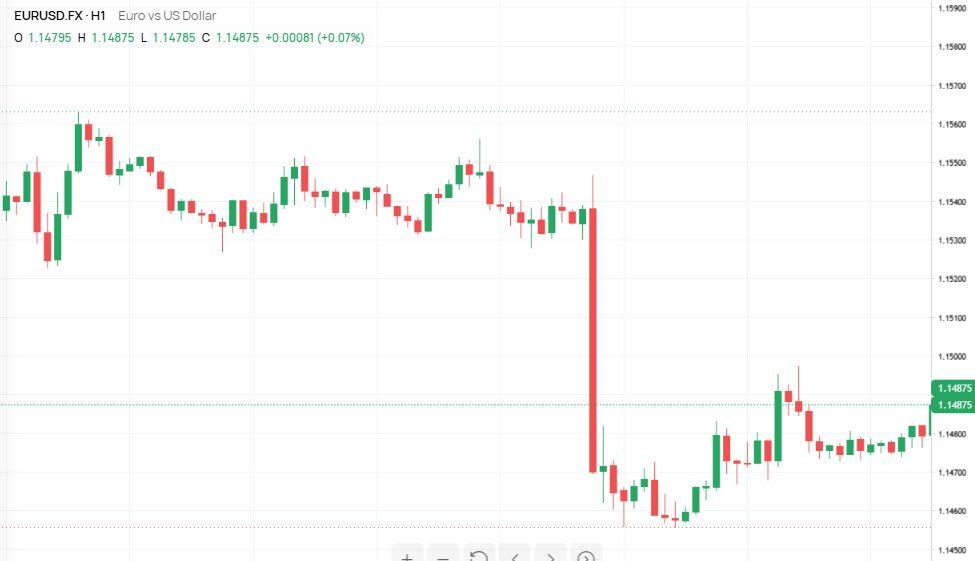
 EUR/USD H1 (one hour) Technical Analysis:
 The
EUR/USD 1-hour chart shows a clear two-phase structure: an initial period of sideways-to-slightly bullish trading around
1.1530–1.1560, followed by a sharp bearish displacement and then a gradual recovery. The most important feature on the chart is the large bearish H1 candle that drove price from approximately
1.1538 down toward 1.1470. This represents a significant change in short-term momentum and creates an important resistance area above the current price. After the sell-off, EUR/USD extended lower, reaching approximately
1.1455 - 1.1457. Price then began forming a recovery characterized by higher lows and several attempts to push upward. This indicates that buyers have become active around the
1.1460 area, although the recovery has not yet completely reversed the earlier bearish move. The current price is around
1.14875, placing it close to an important short-term resistance zone. The first resistance area is approximately
1.1488 - 1.1495. Price previously reacted around this region after the rebound, so a sustained move above it would be technically significant. Above that, the
1.1500 - 1.1510 region becomes the next area to watch. A stronger recovery would eventually need to challenge the origin of the major sell-off around
1.1530 - 1.1540. On the downside, the first important support is around
1.1470 - 1.1465. This zone has repeatedly attracted buying after the sharp decline. Below it,
1.1460 becomes important, followed by the recent swing low near
1.1455. A decisive break below that low would indicate that the recovery has failed and that sellers have regained short-term control. The candlestick structure following the major drop is particularly interesting. Instead of continuing directly lower, the market established a base around
1.1460, rallied toward 1.1480, pulled back, and then attempted another advance. This creates a short-term
higher-low structure, which is constructive for buyers. However, the repeated inability to establish a strong breakout above 1.1490 suggests that upside momentum remains limited. Overall: the chart currently looks like a recovery/consolidation following a strong bearish impulse, rather than a confirmed full bullish reversal. The key technical question is whether price can establish itself above
1.1490 - 1.1500 or instead loses
1.1470 - 1.1460 support. For a bullish scenario, traders would generally watch for a sustained H1 close above resistance followed by successful retesting of that area as support. For a bearish scenario, attention would shift toward a break below the recent higher-low structure and especially the
1.1455 swing low. The major levels visible from this chart are therefore 1.1455 support, 1.1460–1.1470 secondary support, 1.1488 - 1.1495 resistance, and 1.1500 - 1.1510higher resistance. These are technical reference points rather than guaranteed future price levels.
*Analisis pasaran yang dipaparkan di sini hanya bertujuan untuk meningkatkan kesedaran anda, tetapi bukan sebagai petunjuk untuk anda melakukan perdagangan
 Bahasa Malay
 Русский
 English
 Bahasa Indonesia
 ไทย
ไทย Español
 Deutsch
 Български
 Français
 Tiếng Việt
 中文
中文 বাংলা
বাংলা हिन्दी
 Čeština
 Українська
 Română