FX.co ★ #Bitcoin M5: 看跌矩形 技术分析模式 2026-10-27T05:28:41Signal strength 1 of 5 #Bitcoin M5: 看跌矩形 #Bitcoin在M5图表上形成了“看跌矩形”形态,表明趋势可能延续。阻力区位于79935.87–79935.87,支撑区位于79639.47–79639.47。若跌破79639.47支撑位,下跌趋势可能延续。 M5和M15周期可能出现更多虚假入场信号。*此处发布的市场分析旨在提高您的意识,但不提供交易指示 Go to the patterns list Go to graph
 中文

 Русский
 English
 Bahasa Indonesia
 Bahasa Malay
 ไทย
 Español
 Deutsch
 Български
 Français
 Tiếng Việt
 বাংলা
 हिन्दी
 Čeština
 Українська
 Română

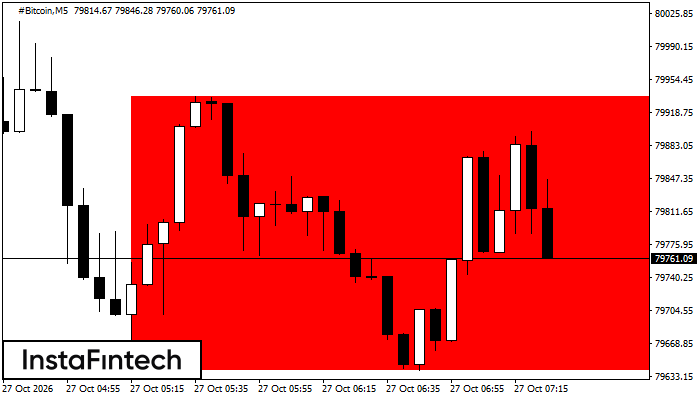 #Bitcoin在M5图表上形成了“看跌矩形”形态,表明趋势可能延续。阻力区位于79935.87–79935.87,支撑区位于79639.47–79639.47。若跌破79639.47支撑位,下跌趋势可能延续。
 #Bitcoin在M5图表上形成了“看跌矩形”形态,表明趋势可能延续。阻力区位于79935.87–79935.87,支撑区位于79639.47–79639.47。若跌破79639.47支撑位,下跌趋势可能延续。