 中文
中文  Русский
 English
 Bahasa Indonesia
 Bahasa Malay
 ไทย
ไทย Español
 Deutsch
 Български
 Français
 Tiếng Việt
 বাংলা
বাংলা हिन्दी
 Čeština
 Українська
 Română
FX.co ★ Actual patterns. Technical analysis and trading recommendations

技术分析模式
There is nothing more precious to a trader than an ability to predict a further price movement. Technical analysis is a key to your successful transaction. At the same time, you can rely on common and recurring situations that arise in the same circumstances. Our Technical Analysis Patterns section features all trading recommendations based on the technical analysis patterns that help traders make projections and turn a profit.
Instrument:
1 selected
#Bitcoin
EURCHF
EURGBP
EURJPY
EURUSD
EURCAD
EURRUB
EURNZD
USDCAD
USDCHF
USDJPY
USDRUB
NZDCAD
NZDUSD
NZDCHF
NZDJPY
AUDCAD
AUDCHF
AUDJPY
AUDUSD
GBPUSD
GBPJPY
GBPAUD
GBPCHF
GOLD
SILVER
#AAPL
#AMZN
#EBAY
#FB
#GOOG
#MCD
#MA
#KO
#INTC
#MSFT
#NTDOY
#PEP
#TSLA
#TWTR
Figure:
所有
Triangle
Rectangle
Pennant
Flag
Head and Shoulders
Double Top
Triple top
Timeframe:
所有
M5
M15
M30
H1
D1
Signal strength:
所有
High
Medium
Low
Signal direction:
所有
Buy
Sell
EURCAD
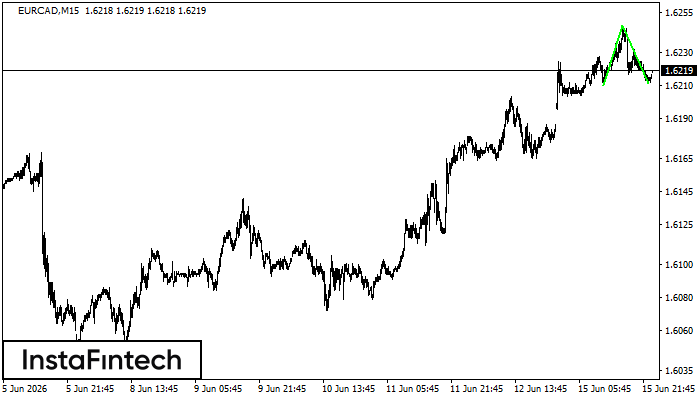
EURCAD M15
Double Bottom
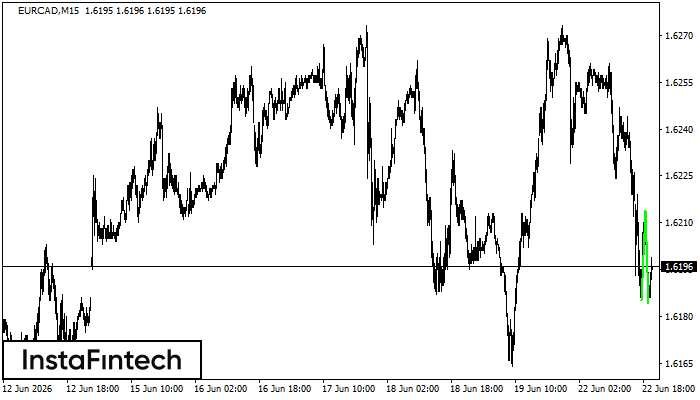
The Double Bottom pattern has been formed on EURCAD M15; the upper boundary is 1.6214; the lower boundary is 1.6184. The width of the pattern is 29 points. In case of a break of the upper boundary 1.6214, a change in the trend can be predicted where the width of the pattern will coincide with the distance to a possible take profit level.
EURCAD M5
Bullish Rectangle
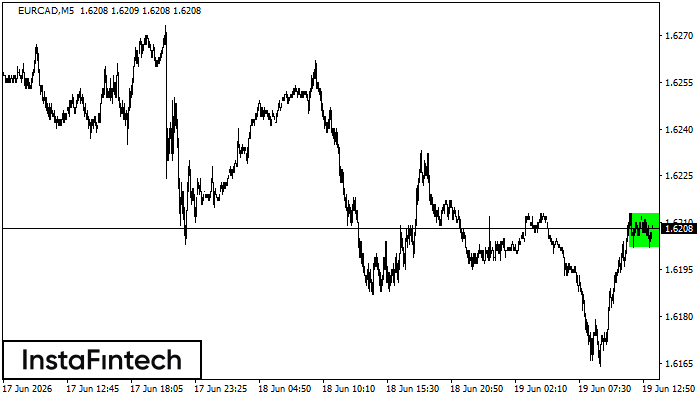
According to the chart of M5, EURCAD formed the Bullish Rectangle. This type of a pattern indicates a trend continuation. It consists of two levels: resistance 1.6213 and support 1.6202. In case the resistance level 1.6213 - 1.6213 is broken, the instrument is likely to follow the bullish trend.
EURCAD M15
Triple Top
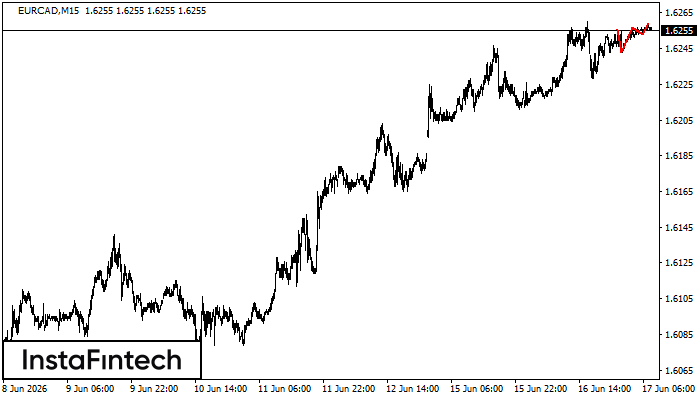
The Triple Top pattern has formed on the chart of the EURCAD M15. Features of the pattern: borders have an ascending angle; the lower line of the pattern has the coordinates 1.6243/1.6253 with the upper limit 1.6256/1.6259; the projection of the width is 13 points. The formation of the Triple Top figure most likely indicates a change in the trend from upward to downward. This means that in the event of a breakdown of the support level of 1.6243, the price is most likely to continue the downward movement.
EURCAD M5
Double Top
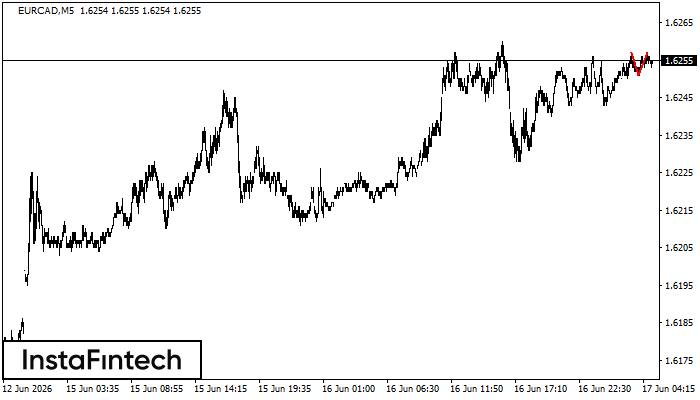
The Double Top reversal pattern has been formed on EURCAD M5. Characteristics: the upper boundary 1.6257; the lower boundary 1.6251; the width of the pattern is 6 points. Sell trades are better to be opened below the lower boundary 1.6251 with a possible movements towards the 1.6236 level.
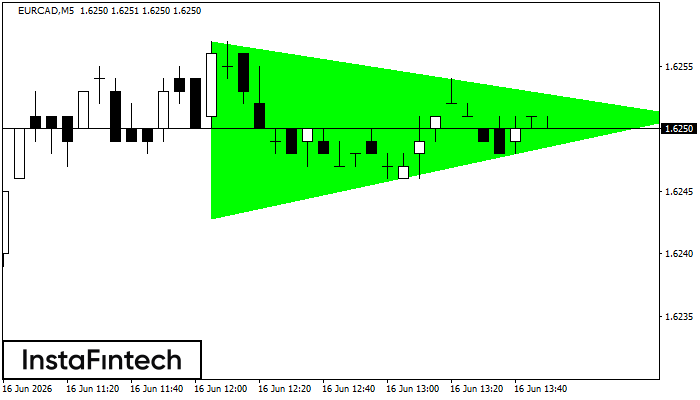
EURCAD M5
Bullish Symmetrical Triangle
According to the chart of M5, EURCAD formed the Bullish Symmetrical Triangle pattern, which signals the trend will continue. Description. The upper border of the pattern touches the coordinates 1.6257/1.6251 whereas the lower border goes across 1.6243/1.6251. The pattern width is measured on the chart at 14 pips. If the Bullish Symmetrical Triangle pattern is in progress during the upward trend, this indicates the current trend will go on. In case 1.6251 is broken, the price could continue its move toward 1.6266.
EURCAD M15
Double Bottom
The Double Bottom pattern has been formed on EURCAD M15. Characteristics: the support level 1.6210; the resistance level 1.6247; the width of the pattern 37 points. If the resistance level is broken, a change in the trend can be predicted with the first target point lying at the distance of 36 points.
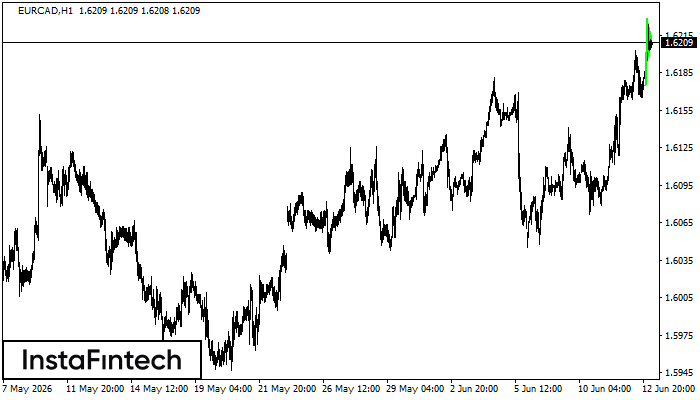
EURCAD H1
Bullish pennant
The Bullish pennant signal – Trading instrument EURCAD H1, continuation pattern. Forecast: it is possible to set up a buy position above the pattern’s high of 1.6228, with the prospect of the next move being a projection of the flagpole height.
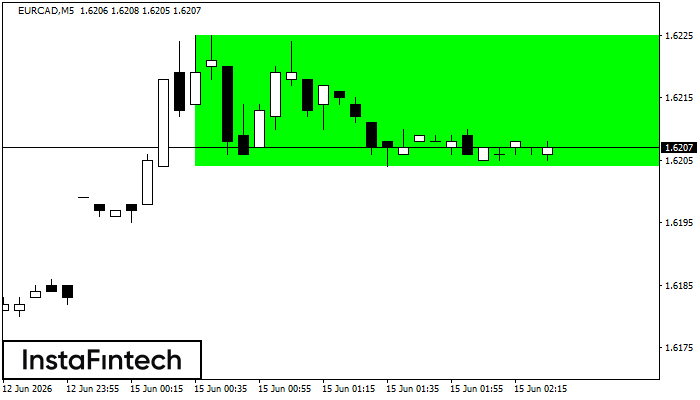
EURCAD M5
Bullish Rectangle
According to the chart of M5, EURCAD formed the Bullish Rectangle which is a pattern of a trend continuation. The pattern is contained within the following borders: the lower border 1.6204 – 1.6204 and upper border 1.6225 – 1.6225. In case the upper border is broken, the instrument is likely to follow the upward trend.
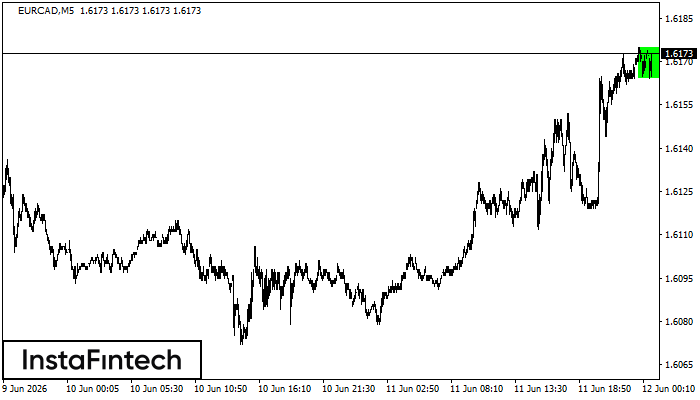
EURCAD M5
Bullish Rectangle
According to the chart of M5, EURCAD formed the Bullish Rectangle which is a pattern of a trend continuation. The pattern is contained within the following borders: the lower border 1.6164 – 1.6164 and upper border 1.6175 – 1.6175. In case the upper border is broken, the instrument is likely to follow the upward trend.
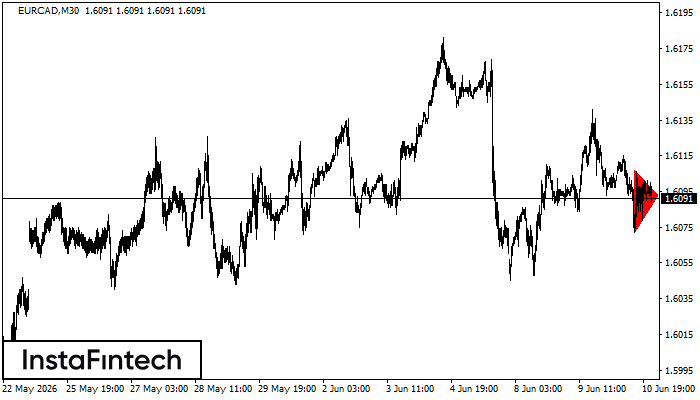
EURCAD M30
Bearish Symmetrical Triangle
According to the chart of M30, EURCAD formed the Bearish Symmetrical Triangle pattern. This pattern signals a further downward trend in case the lower border 1.6072 is breached. Here, a hypothetical profit will equal the width of the available pattern that is -35 pips.