 English
 Русский
 Bahasa Indonesia
 Bahasa Malay
 ไทย
ไทย Español
 Deutsch
 Български
 Français
 Tiếng Việt
 中文
中文 বাংলা
বাংলা हिन्दी
 Čeština
 Українська
 Română
FX.co ★ Patterns #AAPL | Apple Inc. Stock Price

#AAPL M5
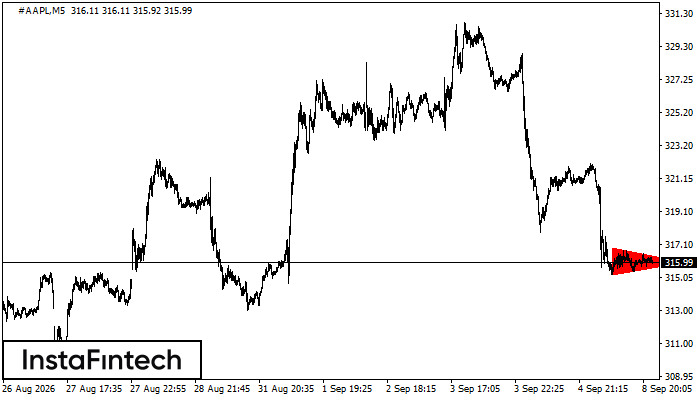
Bearish Symmetrical Triangle
The Bearish Symmetrical Triangle pattern has formed on the #AAPL M5 chart. A break below the lower boundary at 315.23 is likely to signal a continuation of the downtrend.
#AAPL M5
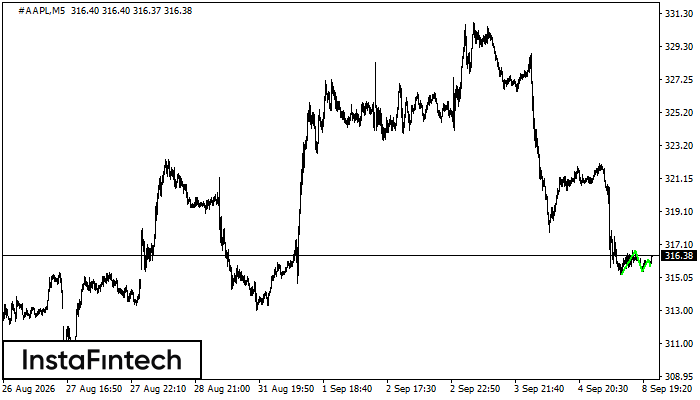
Triple Bottom
The Triple Bottom pattern has formed on the #AAPL M5 chart. It has the following characteristics: resistance at 316.15; support at 315.76; pattern width of 39 points. If the confirmation resistance at 316.73 is broken, the price is likely to continue upward by at least 129 points.
#AAPL M5
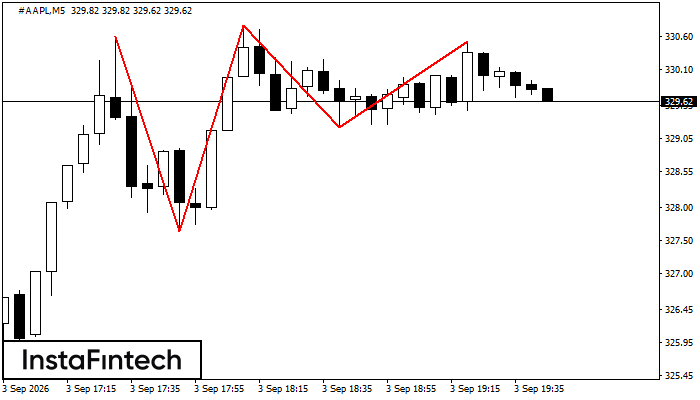
Triple Top
The Triple Top reversal pattern has formed on the #AAPL M5 chart. Its upper boundary is at 330.61/330.53, its lower boundary is at 327.64/329.22, and its current width is 155 points. If the confirmation support at 327.64 is broken, that width can be used to project the downward move.
#AAPL M30
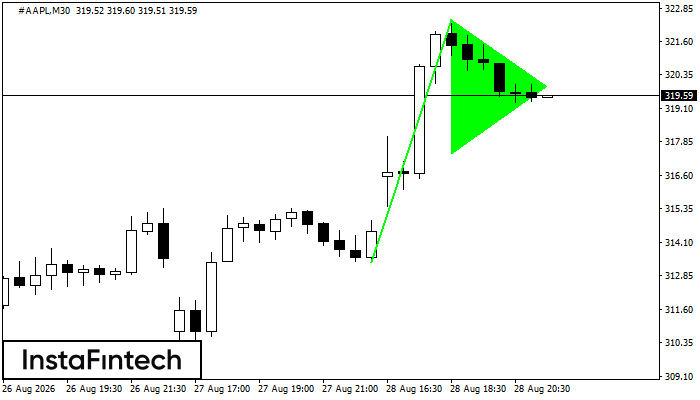
Bullish Pennant
The Bullish Pennant pattern has formed on the #AAPL M30 chart. This is a trend continuation pattern. If the price breaks above the pattern high at 322.43, the uptrend is expected to continue toward 322.73.
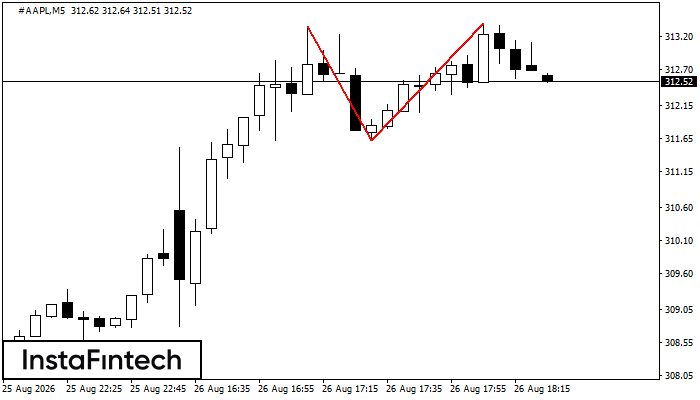
#AAPL M5
Double Top
The Double Top reversal pattern has formed on the #AAPL M5 chart. Its upper boundary is at 313.40, its lower boundary is at 311.62, and its width is 178 points. A break below the lower boundary is likely to confirm further downward movement toward 311.47.
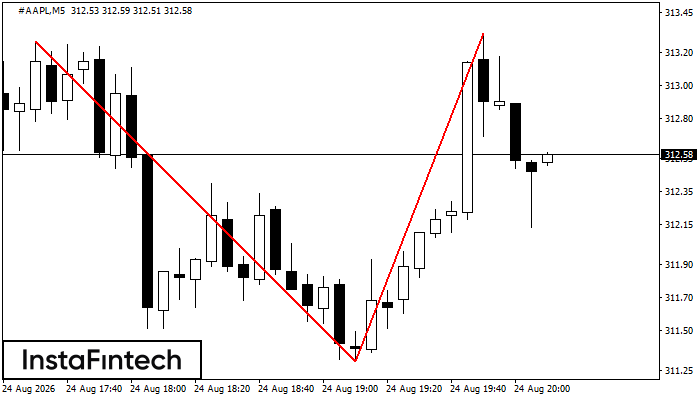
#AAPL M5
Double Top
The Double Top reversal pattern has formed on the #AAPL M5 chart. Its upper boundary is at 313.27, its lower boundary is at 311.31, and its width is 201 points. A short position may be considered below the lower boundary at 311.31, with a potential target at 311.16.
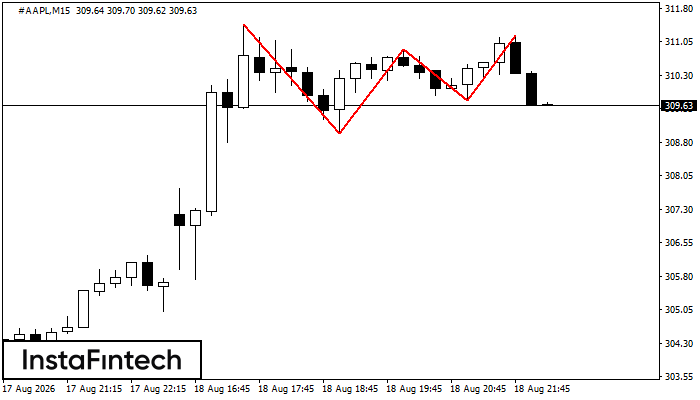
#AAPL M15
Triple Top
The Triple Top pattern has formed on the chart of #AAPL M15 and signals a possible trend reversal. After the third peak forms, a break below the confirmation support at 308.99 may confirm the bearish scenario. The projected peak-to-trough width is 115 points.
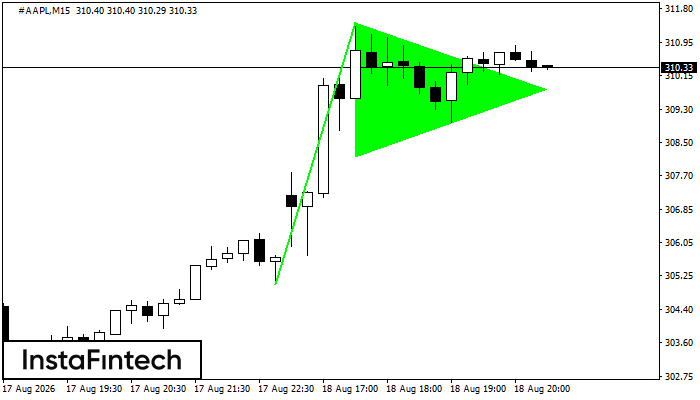
#AAPL M15
Bullish Pennant
A Bullish Pennant continuation signal has formed on the #AAPL M15 chart. A long position may be considered above the pattern high at 311.44, with the projected move based on the height of the flagpole.
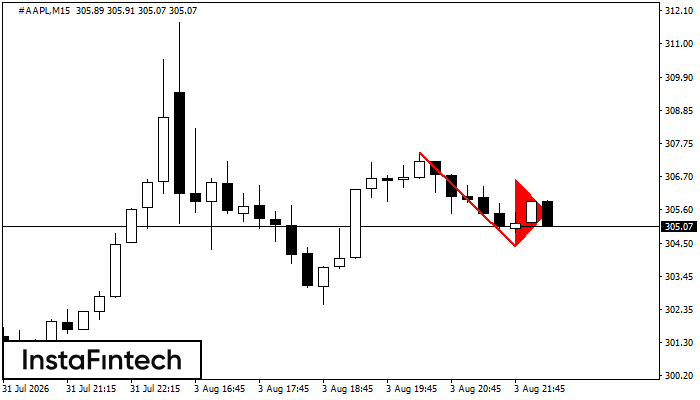
#AAPL M15
Bearish Pennant
The Bearish Pennant pattern has formed on the #AAPL M15 chart. It represents a brief consolidation before the price potentially resumes the prevailing trend. A short position may be considered if the price closes below the pattern low at 304.41.
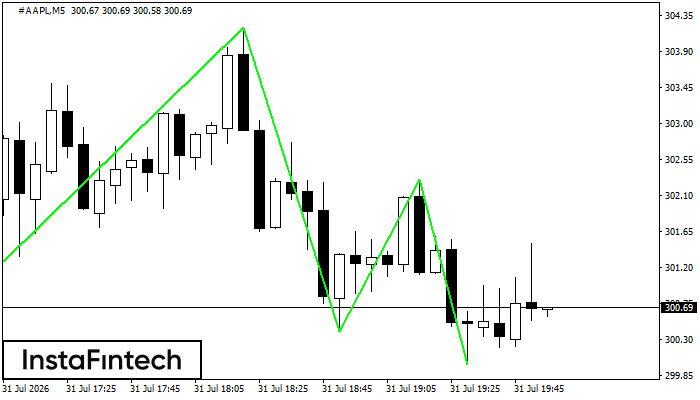
#AAPL M5
Triple Bottom
The Triple Bottom pattern has formed on the chart of #AAPL M5. The lower boundary is at 299.98, while the upper boundary is at 304.20/302.30. The projected width is 381 points. The formation of the Triple Bottom pattern most likely indicates a change from a downward to an upward trend. If the confirmation resistance at 304.20 is broken, the price is likely to continue upward.