 English
  Русский
 Bahasa Indonesia
 Bahasa Malay
 ไทย
ไทย Español
 Deutsch
 Български
 Français
 Tiếng Việt
 中文
中文 বাংলা
বাংলা हिन्दी
 Čeština
 Українська
 Română
FX.co ★ Patterns AUDCAD | Australian Dollar (AUD) to Canadian Dollar (CAD) Rate in the Forex market

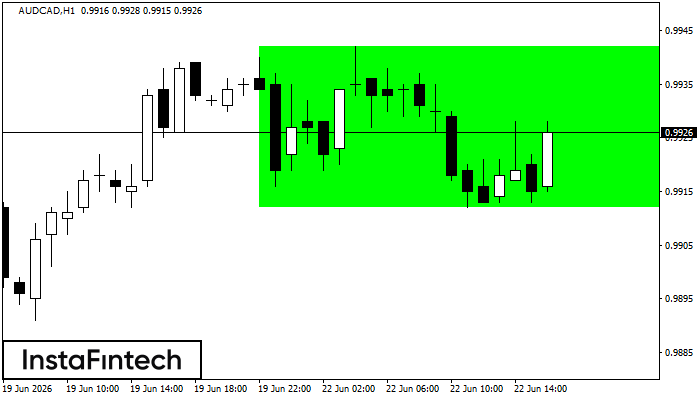
AUDCAD H1
Bullish Rectangle
According to the chart of H1, AUDCAD formed the Bullish Rectangle. This type of a pattern indicates a trend continuation. It consists of two levels: resistance 0.9942 and support 0.9912. In case the resistance level 0.9942 - 0.9942 is broken, the instrument is likely to follow the bullish trend.

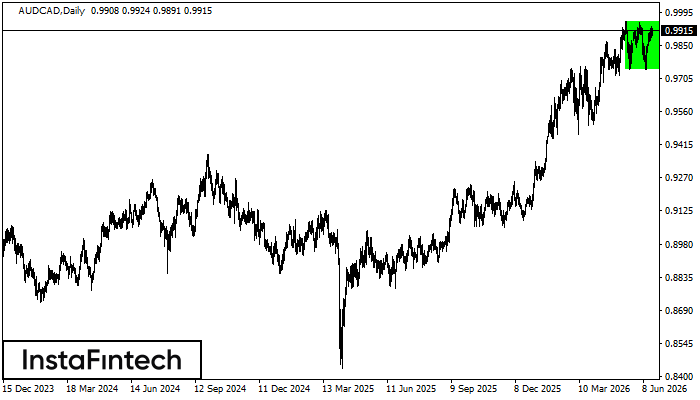
AUDCAD D1
Bullish Rectangle
According to the chart of D1, AUDCAD formed the Bullish Rectangle which is a pattern of a trend continuation. The pattern is contained within the following borders: the lower border 0.9742 – 0.9742 and upper border 0.9954 – 0.9954. In case the upper border is broken, the instrument is likely to follow the upward trend.
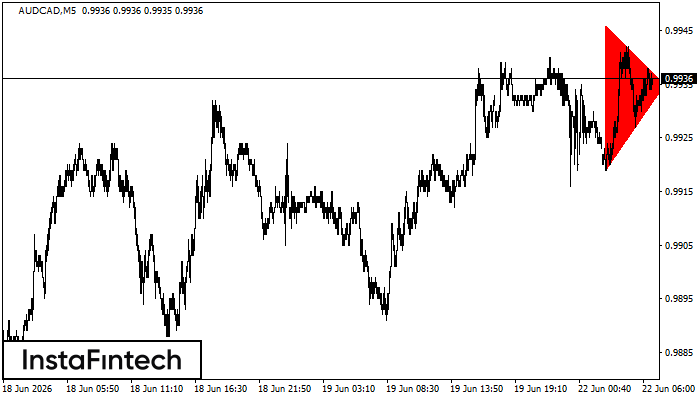
AUDCAD M5
Bearish Symmetrical Triangle
According to the chart of M5, AUDCAD formed the Bearish Symmetrical Triangle pattern. Trading recommendations: A breach of the lower border 0.9919 is likely to encourage a continuation of the downward trend.

AUDCAD D1
Bullish Rectangle
According to the chart of D1, AUDCAD formed the Bullish Rectangle. This type of a pattern indicates a trend continuation. It consists of two levels: resistance 0.9954 and support 0.9742. In case the resistance level 0.9954 - 0.9954 is broken, the instrument is likely to follow the bullish trend.
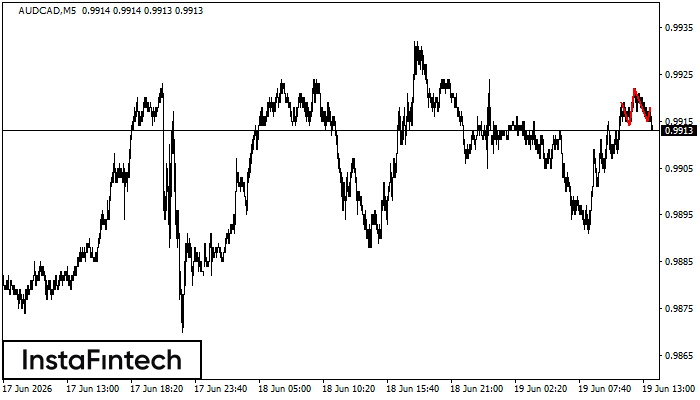
AUDCAD M5
Head and Shoulders
The AUDCAD M5 formed the Head and Shoulders pattern with the following features: The Head’s top is at 0.9922, the Neckline and the upward angle are at 0.9914/0.9915. The formation of this pattern can bring about changes in the current trend from bullish to bearish. In case the pattern triggers the expected changes, the price of AUDCAD will go towards 0.9900.
AUDCAD D1
Bullish Rectangle
According to the chart of D1, AUDCAD formed the Bullish Rectangle which is a pattern of a trend continuation. The pattern is contained within the following borders: the lower border 0.9742 – 0.9742 and upper border 0.9954 – 0.9954. In case the upper border is broken, the instrument is likely to follow the upward trend.
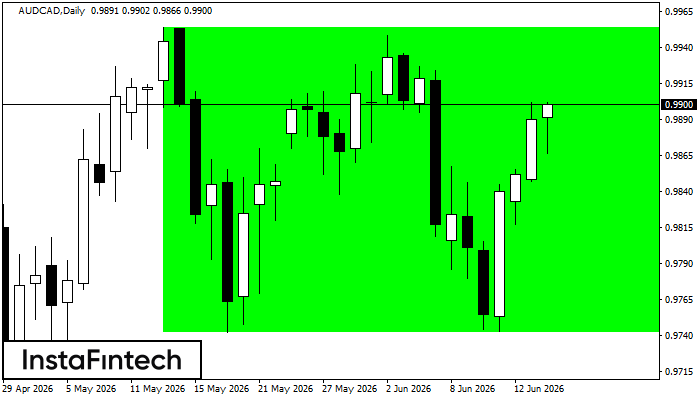
AUDCAD D1
Bullish Rectangle
According to the chart of D1, AUDCAD formed the Bullish Rectangle. The pattern indicates a trend continuation. The upper border is 0.9954, the lower border is 0.9742. The signal means that a long position should be opened above the upper border 0.9954 of the Bullish Rectangle.
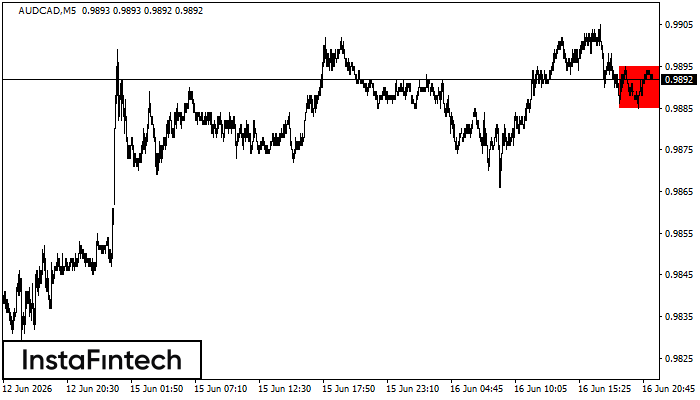
AUDCAD M5
Bearish Rectangle
According to the chart of M5, AUDCAD formed the Bearish Rectangle. This type of a pattern indicates a trend continuation. It consists of two levels: resistance 0.9895 - 0.0000 and support 0.9885 – 0.9885. In case the resistance level 0.9885 - 0.9885 is broken, the instrument is likely to follow the bearish trend.
AUDCAD D1
Bullish Rectangle
According to the chart of D1, AUDCAD formed the Bullish Rectangle. The pattern indicates a trend continuation. The upper border is 0.9954, the lower border is 0.9742. The signal means that a long position should be opened above the upper border 0.9954 of the Bullish Rectangle.
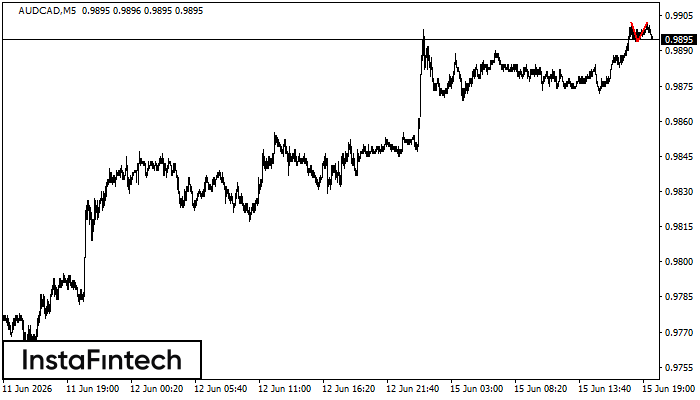
AUDCAD M5
Double Top
On the chart of AUDCAD M5 the Double Top reversal pattern has been formed. Characteristics: the upper boundary 0.9902; the lower boundary 0.9894; the width of the pattern 8 points. The signal: a break of the lower boundary will cause continuation of the downward trend targeting the 0.9879 level.