 English
 Русский
 Bahasa Indonesia
 Bahasa Malay
 ไทย
ไทย Español
 Deutsch
 Български
 Français
 Tiếng Việt
 中文
中文 বাংলা
বাংলা हिन्दी
 Čeština
 Українська
 Română
FX.co ★ Patterns #EBAY | eBay Inc. Stock Price

#EBAY M5
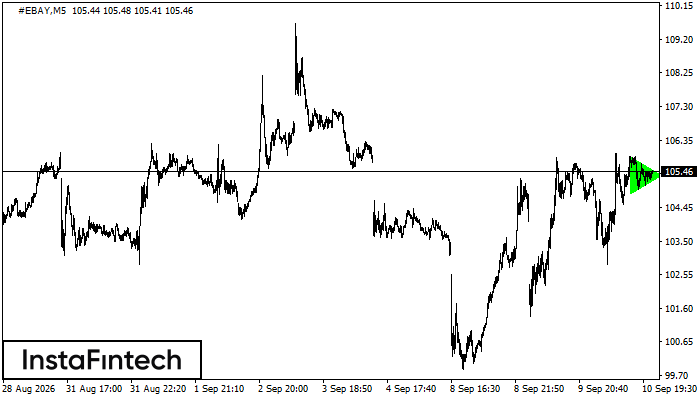
Bullish Symmetrical Triangle
The Bullish Symmetrical Triangle pattern has formed on the #EBAY M5 chart, signaling a likely continuation of the trend. Its upper boundary passes through 105.89/105.34, while its lower boundary passes through 104.84/105.34. The pattern width is 105 points. When the Bullish Symmetrical Triangle forms during an uptrend, it indicates that the prevailing trend may continue. A breakout above 105.34 could send the price toward 105.49.
#EBAY M5
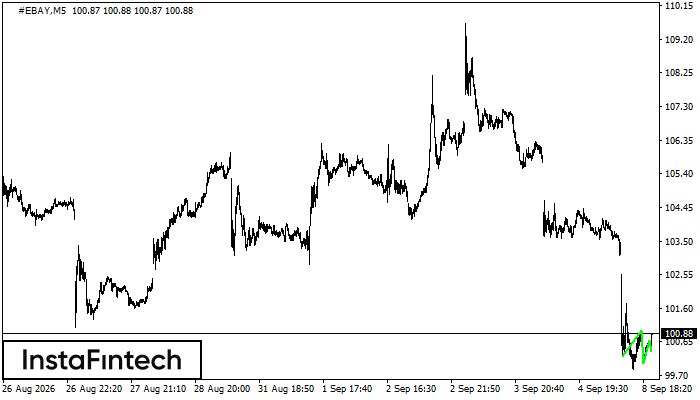
Triple Bottom
The Triple Bottom pattern has formed on the chart of #EBAY M5. The lower boundary is at 100.37, while the upper boundary is at 100.96/100.69. The projected width is 92 points. The formation of the Triple Bottom pattern most likely indicates a change from a downward to an upward trend. If the confirmation resistance at 100.96 is broken, the price is likely to continue upward.
#EBAY M30
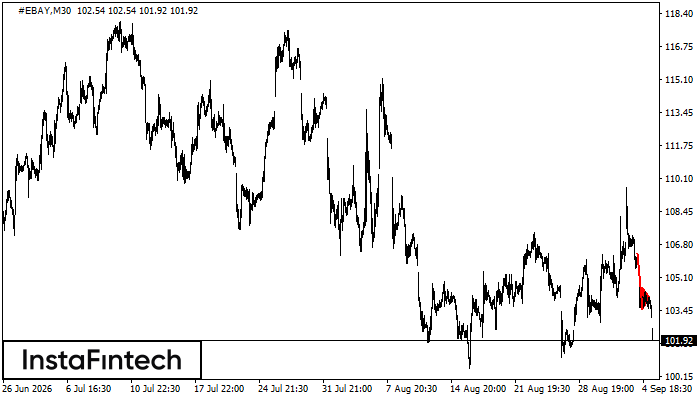
Bearish Pennant
The Bearish Pennant pattern has formed on the #EBAY M30 chart. It represents a brief consolidation before the price potentially resumes the prevailing trend. A short position may be considered if the price closes below the pattern low at 103.52.
#EBAY M30
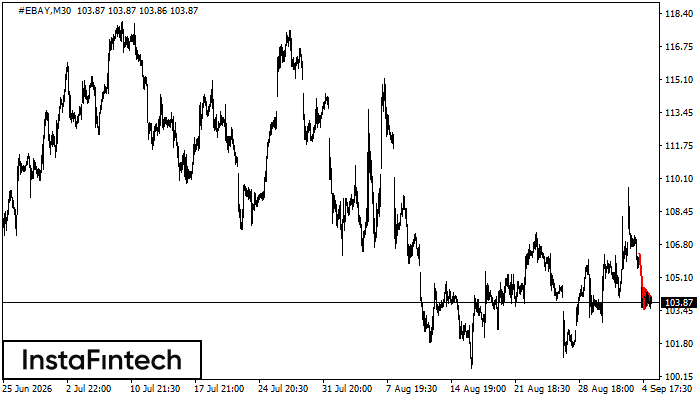
Bearish Pennant
The Bearish Pennant pattern has formed on the #EBAY M30 chart. A break below the pennant low at 103.52 would signal a likely continuation of the downtrend. A Sell Stop order may be placed 10 points below the pattern low, with Take Profit set at a distance equal to the height of the flagpole.
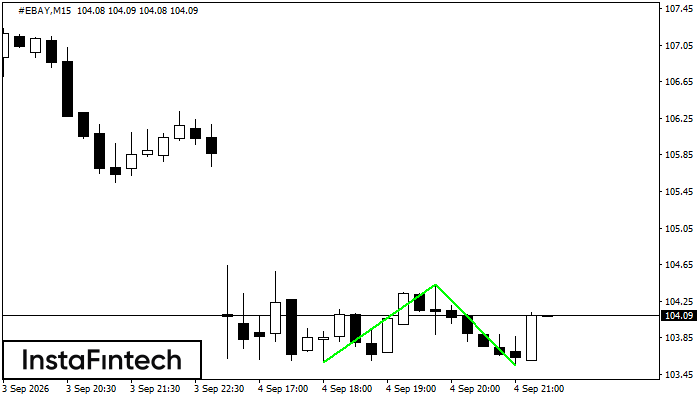
#EBAY M15
Double Bottom
The Double Bottom pattern has formed on the #EBAY M15 chart and signals a potential reversal from a downtrend to an uptrend. A long position may be considered after the price breaks above the upper boundary at 104.43. The projected move is based on the pattern width of 85 points.
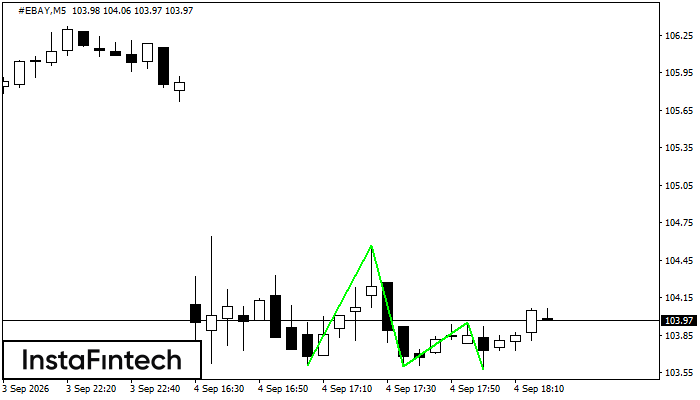
#EBAY M5
Triple Bottom
The Triple Bottom pattern has formed on the #EBAY M5 chart. A break above the confirmation resistance at 104.57 may signal a reversal from a downtrend to an uptrend.
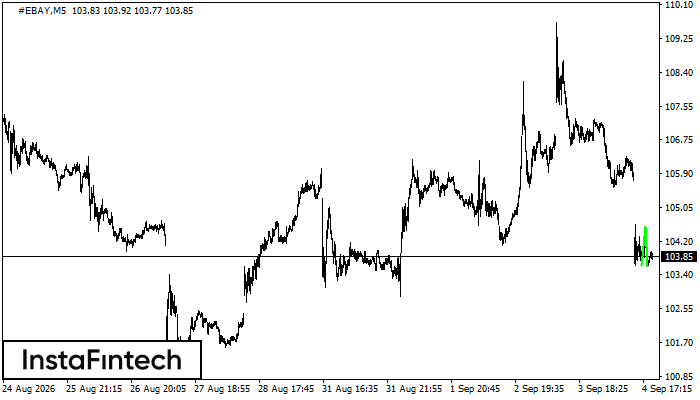
#EBAY M5
Double Bottom
The Double Bottom pattern has formed on the #EBAY M5 chart. Its upper boundary is at 104.57, its lower boundary is at 103.60, and its width is 96 points. A break above the upper boundary at 104.57 may confirm a trend reversal, with the pattern width defining the projected distance to a potential Take Profit level.
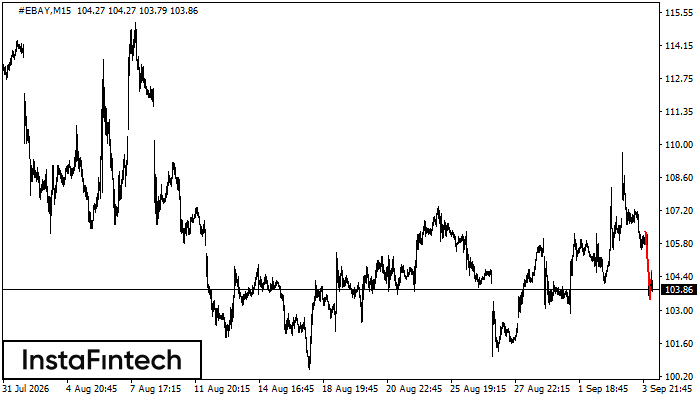
#EBAY M15
Bearish Flag
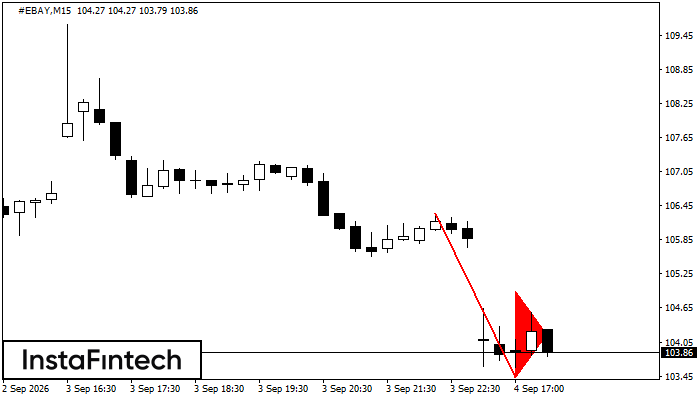
The Bearish Flag pattern has formed on the #EBAY M15 chart, indicating that the downtrend may continue in the near term. A short position may be considered after the price breaks below the pattern low at 103.43.
#EBAY M15
Bearish Pennant
The Bearish Pennant pattern has formed on the #EBAY M15 chart. A break below the pennant low at 103.43 would signal a likely continuation of the downtrend. A Sell Stop order may be placed 10 points below the pattern low, with Take Profit set at a distance equal to the height of the flagpole.
#EBAY M5
Bearish Symmetrical Triangle
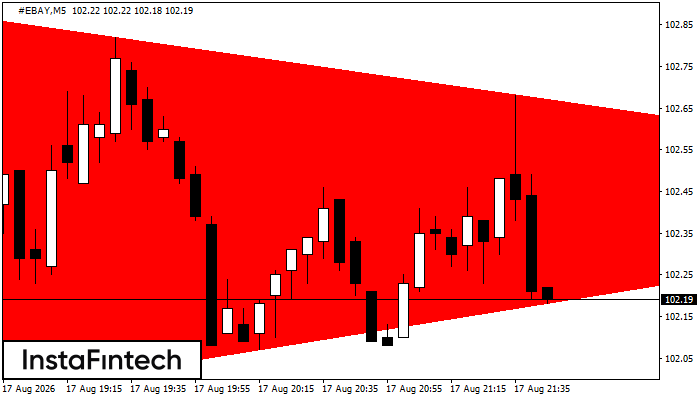
The Bearish Symmetrical Triangle pattern has formed on the #EBAY M5 chart. A break below the lower boundary at 101.94 would signal a likely continuation of the downtrend. The projected move corresponds to the pattern width of 95 points.