 English
  Русский
 Bahasa Indonesia
 Bahasa Malay
 ไทย
ไทย Español
 Deutsch
 Български
 Français
 Tiếng Việt
 中文
中文 বাংলা
বাংলা हिन्दी
 Čeština
 Українська
 Română
FX.co ★ Patterns EURJPY | Euro (EUR) to Japanese Yen (JPY) Rate in the Forex market

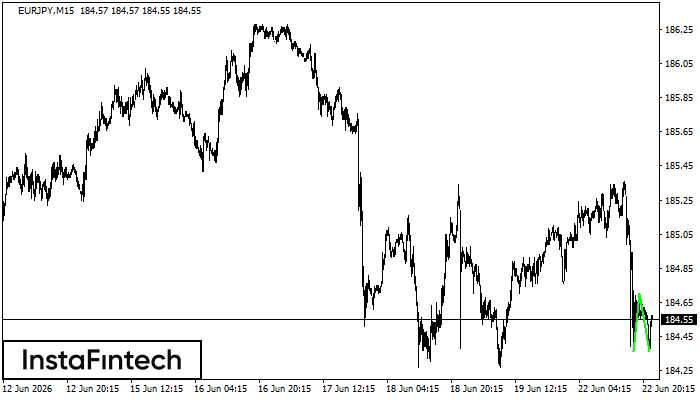
EURJPY M15
Double Bottom
The Double Bottom pattern has been formed on EURJPY M15. This formation signals a reversal of the trend from downwards to upwards. The signal is that a buy trade should be opened after the upper boundary of the pattern 184.70 is broken. The further movements will rely on the width of the current pattern 34 points.
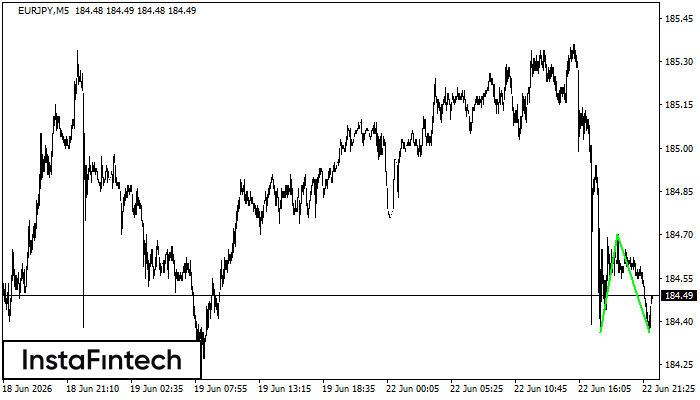
EURJPY M5
Double Bottom
The Double Bottom pattern has been formed on EURJPY M5; the upper boundary is 184.70; the lower boundary is 184.36. The width of the pattern is 34 points. In case of a break of the upper boundary 184.70, a change in the trend can be predicted where the width of the pattern will coincide with the distance to a possible take profit level.
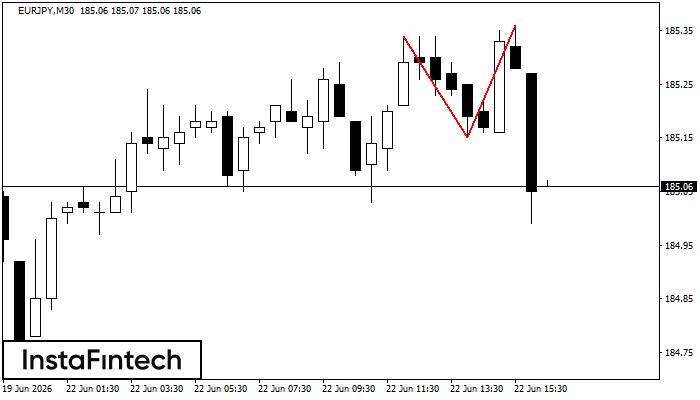
EURJPY M30
Double Top
On the chart of EURJPY M30 the Double Top reversal pattern has been formed. Characteristics: the upper boundary 185.36; the lower boundary 185.15; the width of the pattern 21 points. The signal: a break of the lower boundary will cause continuation of the downward trend targeting the 184.85 level.
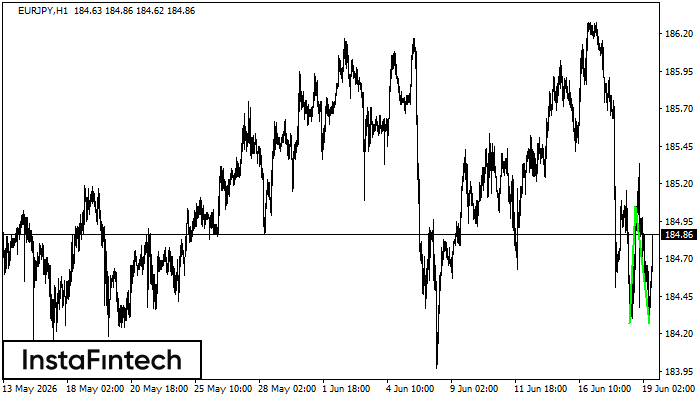
EURJPY H1
Double Bottom
The Double Bottom pattern has been formed on EURJPY H1; the upper boundary is 185.05; the lower boundary is 184.27. The width of the pattern is 78 points. In case of a break of the upper boundary 185.05, a change in the trend can be predicted where the width of the pattern will coincide with the distance to a possible take profit level.
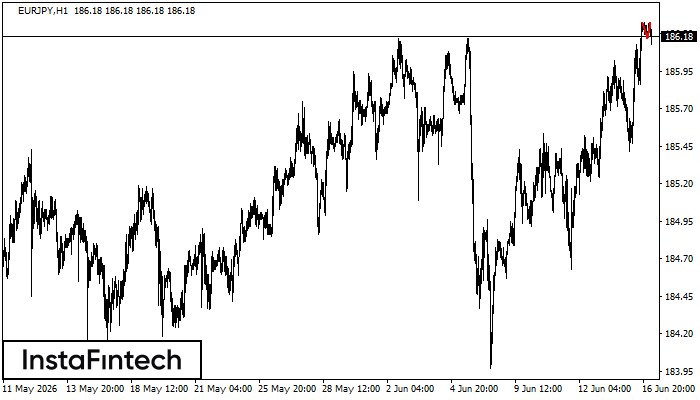
EURJPY H1
Double Top
The Double Top reversal pattern has been formed on EURJPY H1. Characteristics: the upper boundary 186.28; the lower boundary 186.17; the width of the pattern is 11 points. Sell trades are better to be opened below the lower boundary 186.17 with a possible movements towards the 185.77 level.
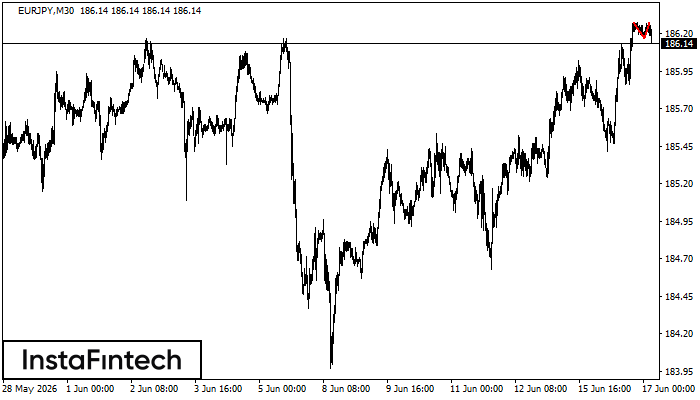
EURJPY M30
Double Top
The Double Top reversal pattern has been formed on EURJPY M30. Characteristics: the upper boundary 186.28; the lower boundary 186.17; the width of the pattern is 11 points. Sell trades are better to be opened below the lower boundary 186.17 with a possible movements towards the 185.87 level.
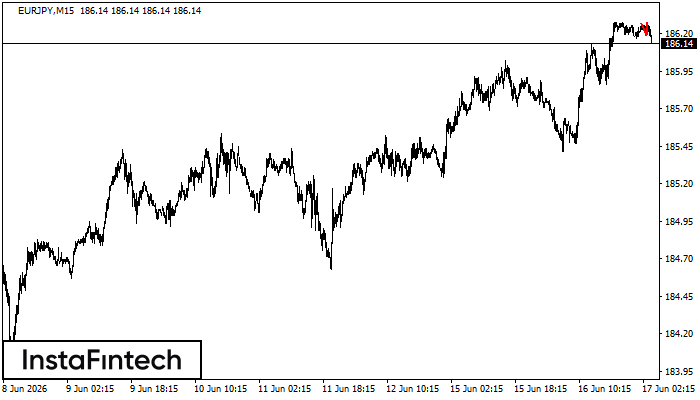
EURJPY M15
Double Top
The Double Top reversal pattern has been formed on EURJPY M15. Characteristics: the upper boundary 186.27; the lower boundary 186.19; the width of the pattern is 9 points. Sell trades are better to be opened below the lower boundary 186.19 with a possible movements towards the 185.96 level.
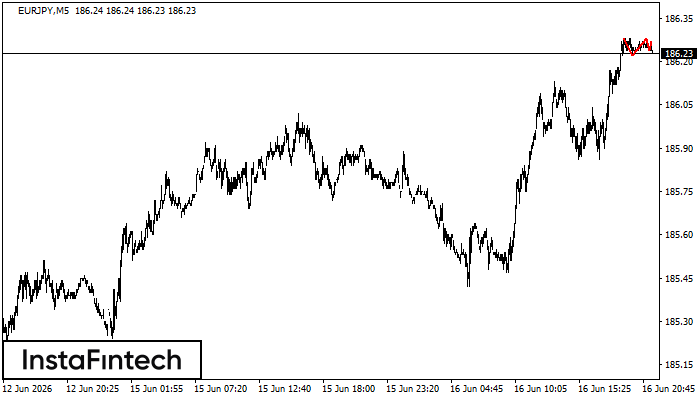
EURJPY M5
Triple Top
The Triple Top pattern has formed on the chart of the EURJPY M5 trading instrument. It is a reversal pattern featuring the following characteristics: resistance level 1, support level -2, and pattern’s width 6. Forecast If the price breaks through the support level 186.22, it is likely to move further down to 186.13.

EURJPY M5
Double Top
The Double Top reversal pattern has been formed on EURJPY M5. Characteristics: the upper boundary 186.28; the lower boundary 186.22; the width of the pattern is 6 points. Sell trades are better to be opened below the lower boundary 186.22 with a possible movements towards the 186.07 level.
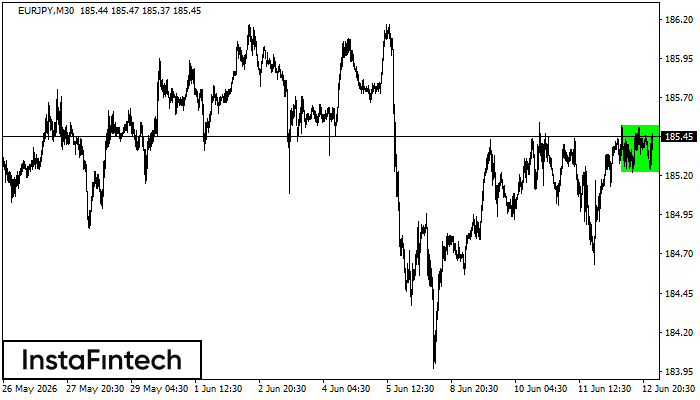
EURJPY M30
Bullish Rectangle
According to the chart of M30, EURJPY formed the Bullish Rectangle. This type of a pattern indicates a trend continuation. It consists of two levels: resistance 185.52 and support 185.22. In case the resistance level 185.52 - 185.52 is broken, the instrument is likely to follow the bullish trend.