 English
  Русский
 Bahasa Indonesia
 Bahasa Malay
 ไทย
ไทย Español
 Deutsch
 Български
 Français
 Tiếng Việt
 中文
中文 বাংলা
বাংলা हिन्दी
 Čeština
 Українська
 Română
FX.co ★ Patterns EURNZD | Euro (EUR) to New Zealand Dollar (NZD) Rate in the Forex market

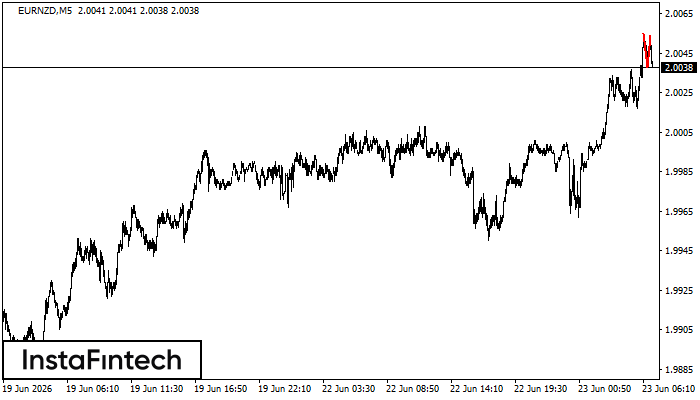
EURNZD M5
Double Top
The Double Top pattern has been formed on EURNZD M5. It signals that the trend has been changed from upwards to downwards. Probably, if the base of the pattern 2.0038 is broken, the downward movement will continue.
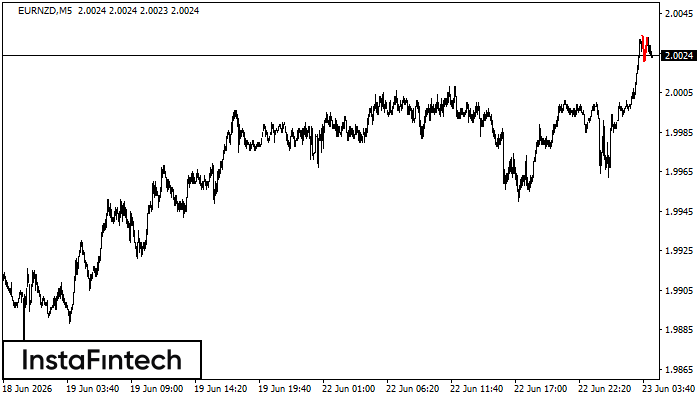
EURNZD M5
Double Top
The Double Top reversal pattern has been formed on EURNZD M5. Characteristics: the upper boundary 2.0034; the lower boundary 2.0021; the width of the pattern is 12 points. Sell trades are better to be opened below the lower boundary 2.0021 with a possible movements towards the 2.0006 level.
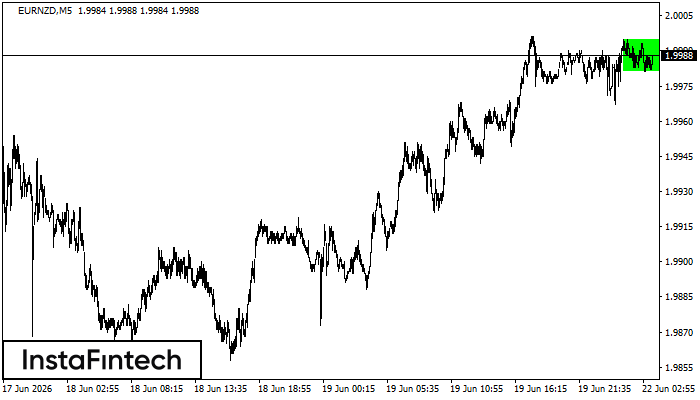
EURNZD M5
Bullish Rectangle
According to the chart of M5, EURNZD formed the Bullish Rectangle which is a pattern of a trend continuation. The pattern is contained within the following borders: the lower border 1.9981 – 1.9981 and upper border 1.9995 – 1.9995. In case the upper border is broken, the instrument is likely to follow the upward trend.
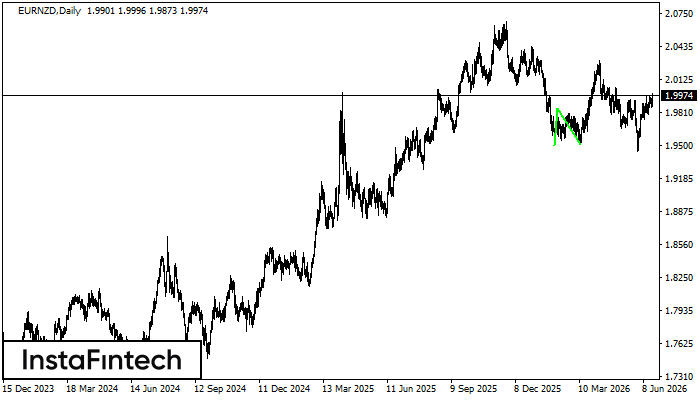
EURNZD D1
Double Bottom
The Double Bottom pattern has been formed on EURNZD D1; the upper boundary is 1.9851; the lower boundary is 1.9509. The width of the pattern is 355 points. In case of a break of the upper boundary 1.9851, a change in the trend can be predicted where the width of the pattern will coincide with the distance to a possible take profit level.
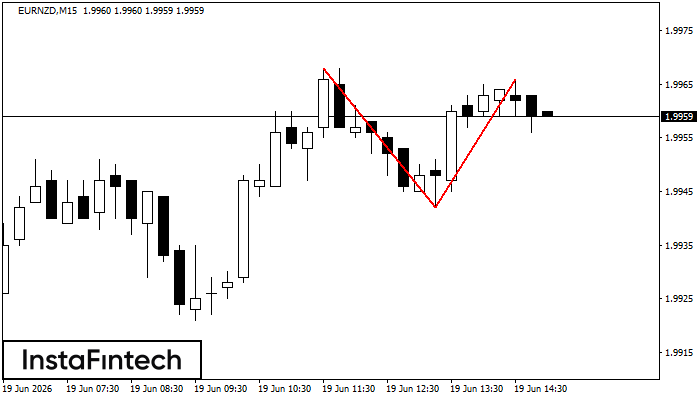
EURNZD M15
Double Top
On the chart of EURNZD M15 the Double Top reversal pattern has been formed. Characteristics: the upper boundary 1.9966; the lower boundary 1.9942; the width of the pattern 24 points. The signal: a break of the lower boundary will cause continuation of the downward trend targeting the 1.9920 level.
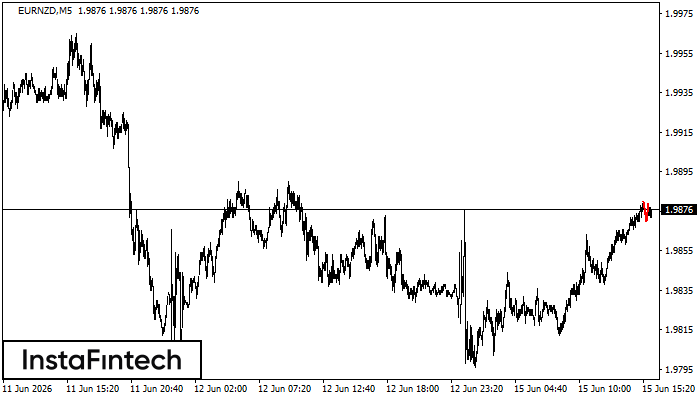
EURNZD M5
Double Top
On the chart of EURNZD M5 the Double Top reversal pattern has been formed. Characteristics: the upper boundary 1.9879; the lower boundary 1.9870; the width of the pattern 9 points. The signal: a break of the lower boundary will cause continuation of the downward trend targeting the 1.9855 level.
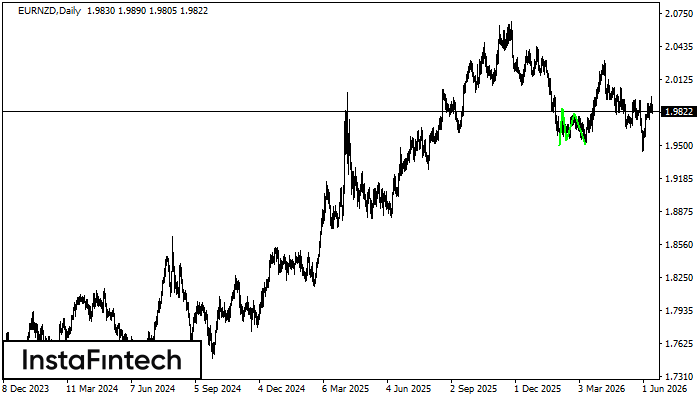
EURNZD D1
Triple Bottom
The Triple Bottom pattern has been formed on EURNZD D1. It has the following characteristics: resistance level 1.9851/1.9803; support level 1.9496/1.9509; the width is 355 points. In the event of a breakdown of the resistance level of 1.9851, the price is likely to continue an upward movement at least to 1.9592.

EURNZD D1
Triple Bottom
The Triple Bottom pattern has formed on the chart of EURNZD D1. Features of the pattern: The lower line of the pattern has coordinates 1.9851 with the upper limit 1.9851/1.9803, the projection of the width is 355 points. The formation of the Triple Bottom pattern most likely indicates a change in the trend from downward to upward. This means that in the event of a breakdown of the resistance level 1.9496, the price is most likely to continue the upward movement.
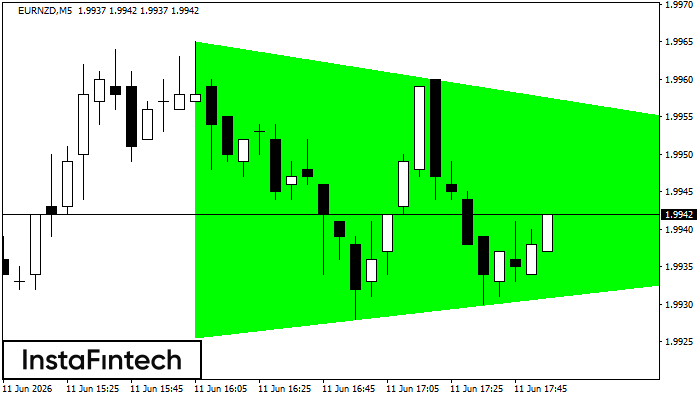
EURNZD M5
Bullish Symmetrical Triangle
According to the chart of M5, EURNZD formed the Bullish Symmetrical Triangle pattern. Description: This is the pattern of a trend continuation. 1.9965 and 1.9925 are the coordinates of the upper and lower borders respectively. The pattern width is measured on the chart at 40 pips. Outlook: If the upper border 1.9965 is broken, the price is likely to continue its move by 1.9957.