 English

 Русский
 Bahasa Indonesia
 Bahasa Malay
 ไทย
 Español
 Deutsch
 Български
 Français
 Tiếng Việt
 中文
 বাংলা
 हिन्दी
 Čeština
 Українська
 Română

FX.co ★ Patterns #MCD | McDonald's Corporation Stock Price

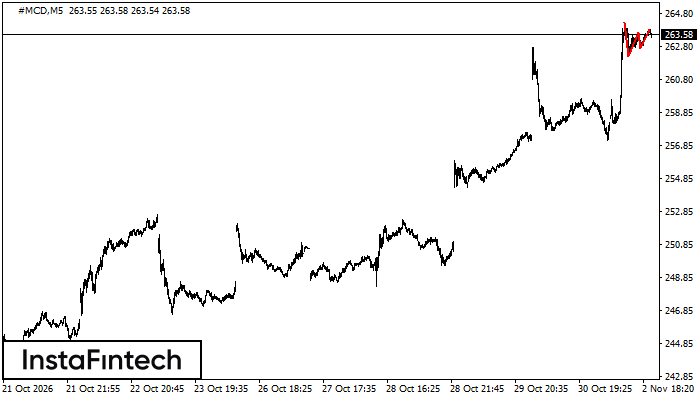
#MCD M5
Triple Top
The Triple Top pattern has formed on the chart of #MCD M5 and signals a possible trend reversal. After the third peak forms, a break below the confirmation support at 262.24 may confirm the bearish scenario. The projected peak-to-trough width is 101 points.
#MCD M5
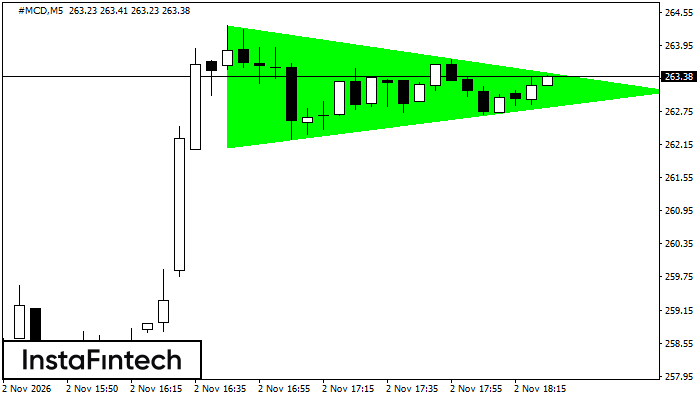
Bullish Symmetrical Triangle
The Bullish Symmetrical Triangle pattern has formed on the #MCD M5 chart, signaling a likely continuation of the trend. Its upper boundary passes through 264.31/263.12, while its lower boundary passes through 262.09/263.12. The pattern width is 222 points. When the Bullish Symmetrical Triangle forms during an uptrend, it indicates that the prevailing trend may continue. A breakout above 263.12 could send the price toward 263.27.
#MCD M5
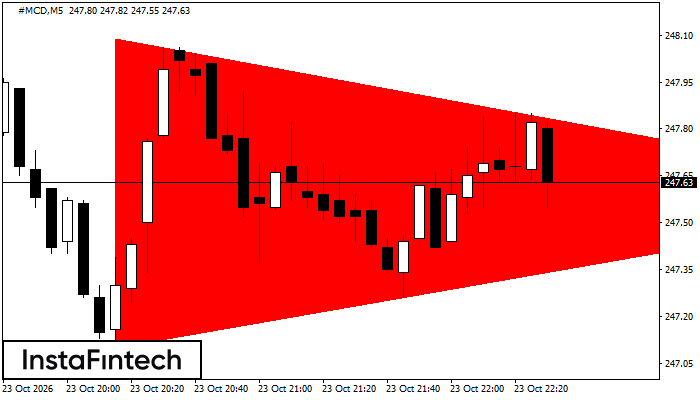
Bearish Symmetrical Triangle
The Bearish Symmetrical Triangle pattern has formed on the #MCD M5 chart. A break below the lower boundary at 247.10 would signal a likely continuation of the downtrend. The projected move corresponds to the pattern width of 99 points.
#MCD M5
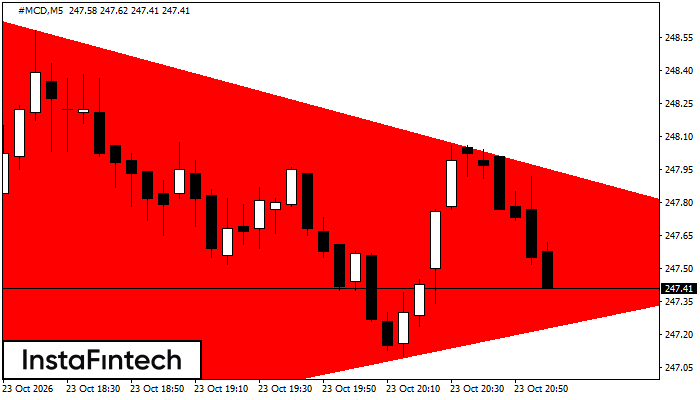
Bearish Symmetrical Triangle
The Bearish Symmetrical Triangle pattern has formed on the #MCD M5 chart. Its lower boundary passes through 246.63/247.54, while its upper boundary passes through 248.74/247.54. The pattern width is 211 points. The Bearish Symmetrical Triangle indicates a likely continuation of the downtrend. If #MCD breaks below the lower boundary, the price could move toward 247.39.
#MCD M5
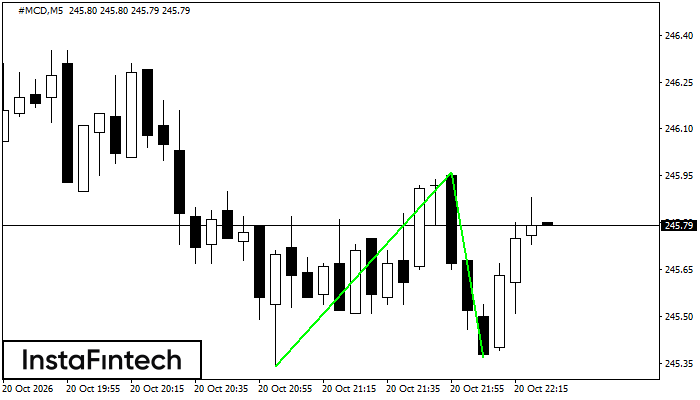
Double Bottom
The Double Bottom pattern has formed on the #MCD M5 chart. Its support is at 245.34, its resistance is at 245.96, and its width is 62 points. A break above resistance may confirm a trend reversal, with the first target projected 59 points away.
#MCD M5
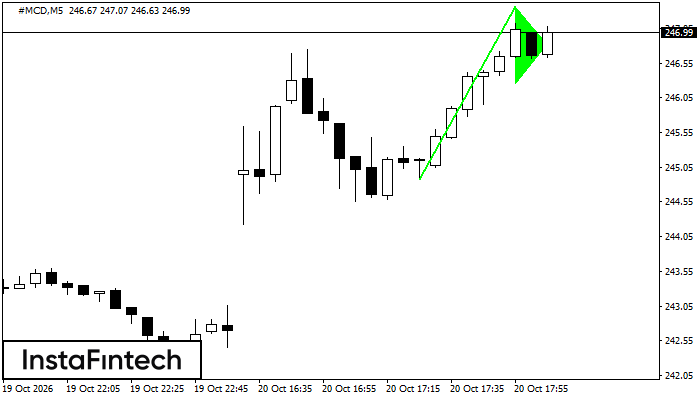
Bullish Pennant
A Bullish Pennant continuation signal has formed on the #MCD M5 chart. A long position may be considered above the pattern high at 247.36, with the projected move based on the height of the flagpole.
#MCD M15
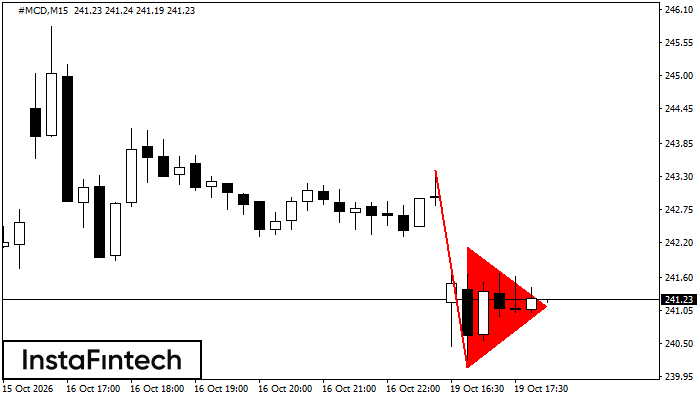
Bearish Pennant
The Bearish Pennant pattern has formed on the #MCD M15 chart. A break below the pennant low at 240.10 would signal a likely continuation of the downtrend. A Sell Stop order may be placed 10 points below the pattern low, with Take Profit set at a distance equal to the height of the flagpole.
#MCD M30
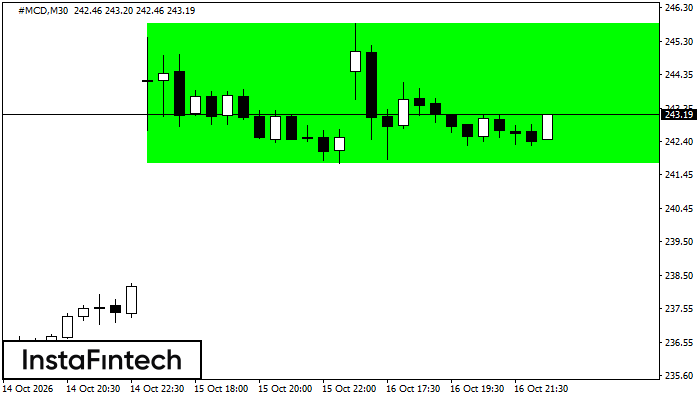
Bullish Rectangle
The Bullish Rectangle has formed on the #MCD M30 chart and indicates a likely continuation of the trend. Its upper boundary is at 245.82 and its lower boundary is at 241.75. A long position may be considered after the price breaks above the upper boundary at 245.82 of the Bullish Rectangle.
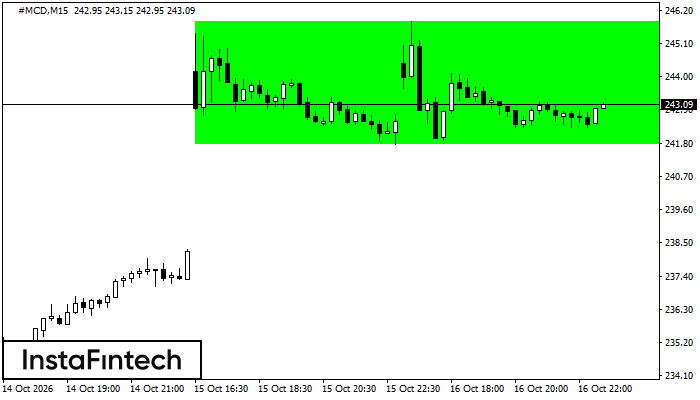
#MCD M15
Bullish Rectangle
The Bullish Rectangle has formed on the #MCD M15 chart and indicates a likely continuation of the trend. Its upper boundary is at 245.82 and its lower boundary is at 241.75. A long position may be considered after the price breaks above the upper boundary at 245.82 of the Bullish Rectangle.
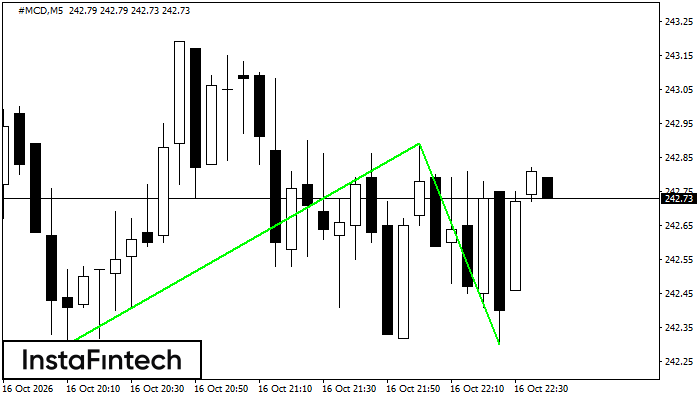
#MCD M5
Double Bottom
The Double Bottom pattern has formed on the #MCD M5 chart and signals a potential reversal from a downtrend to an uptrend. A long position may be considered after the price breaks above the upper boundary at 242.89. The projected move is based on the pattern width of 59 points.