 English
  Русский
 Bahasa Indonesia
 Bahasa Malay
 ไทย
ไทย Español
 Deutsch
 Български
 Français
 Tiếng Việt
 中文
中文 বাংলা
বাংলা हिन्दी
 Čeština
 Українська
 Română
FX.co ★ Patterns NZDCAD | New Zealand Dollar (NZD) to Canadian Dollar (CAD) Rate in the Forex market

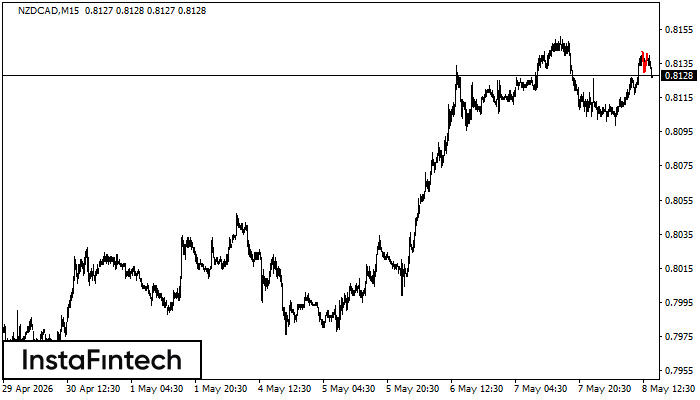
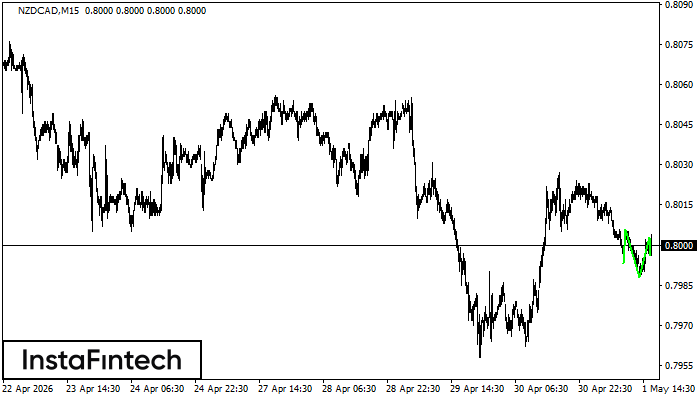
NZDCAD M15
Double Top
On the chart of NZDCAD M15 the Double Top reversal pattern has been formed. Characteristics: the upper boundary 0.8141; the lower boundary 0.8130; the width of the pattern 11 points. The signal: a break of the lower boundary will cause continuation of the downward trend targeting the 0.8108 level.
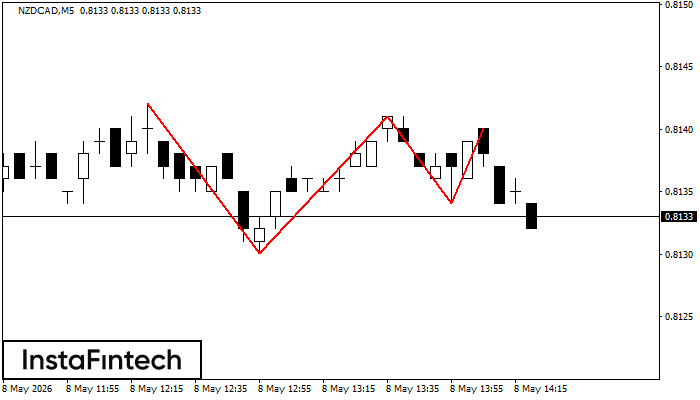
NZDCAD M5
Triple Top
The Triple Top pattern has formed on the chart of the NZDCAD M5 trading instrument. It is a reversal pattern featuring the following characteristics: resistance level 2, support level -4, and pattern’s width 12. Forecast If the price breaks through the support level 0.8130, it is likely to move further down to 0.8126.
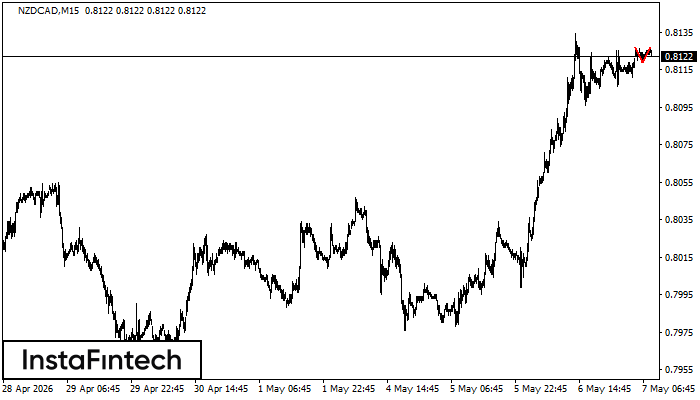
NZDCAD M15
Double Top
The Double Top pattern has been formed on NZDCAD M15. It signals that the trend has been changed from upwards to downwards. Probably, if the base of the pattern 0.8119 is broken, the downward movement will continue.
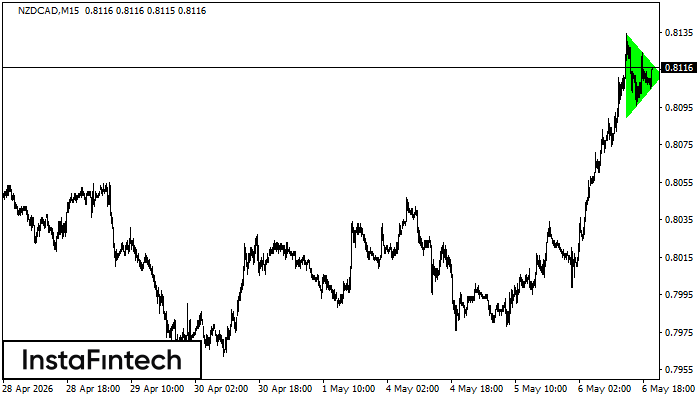
NZDCAD M15
Bullish Symmetrical Triangle
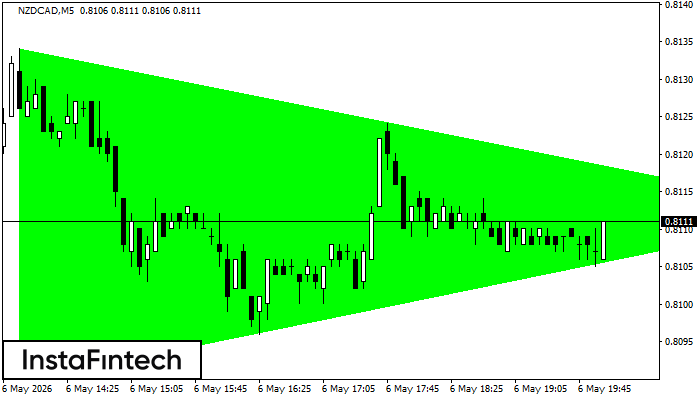
According to the chart of M15, NZDCAD formed the Bullish Symmetrical Triangle pattern. Description: This is the pattern of a trend continuation. 0.8134 and 0.8090 are the coordinates of the upper and lower borders respectively. The pattern width is measured on the chart at 44 pips. Outlook: If the upper border 0.8134 is broken, the price is likely to continue its move by 0.8134.
NZDCAD M5
Bullish Symmetrical Triangle
According to the chart of M5, NZDCAD formed the Bullish Symmetrical Triangle pattern. The lower border of the pattern touches the coordinates 0.8090/0.8112 whereas the upper border goes across 0.8134/0.8112. If the Bullish Symmetrical Triangle pattern is in progress, this evidently signals a further upward trend. In other words, in case the scenario comes true, the price of NZDCAD will breach the upper border to head for 0.8127.

NZDCAD H1
Double Bottom
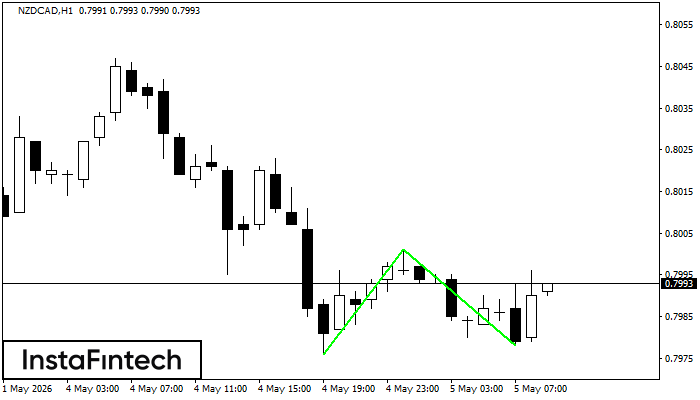
The Double Bottom pattern has been formed on NZDCAD H1; the upper boundary is 0.8001; the lower boundary is 0.7978. The width of the pattern is 25 points. In case of a break of the upper boundary 0.8001, a change in the trend can be predicted where the width of the pattern will coincide with the distance to a possible take profit level.
NZDCAD H1
Double Bottom
The Double Bottom pattern has been formed on NZDCAD H1; the upper boundary is 0.8001; the lower boundary is 0.7978. The width of the pattern is 25 points. In case of a break of the upper boundary 0.8001, a change in the trend can be predicted where the width of the pattern will coincide with the distance to a possible take profit level.
NZDCAD M5
Inverse Head and Shoulder
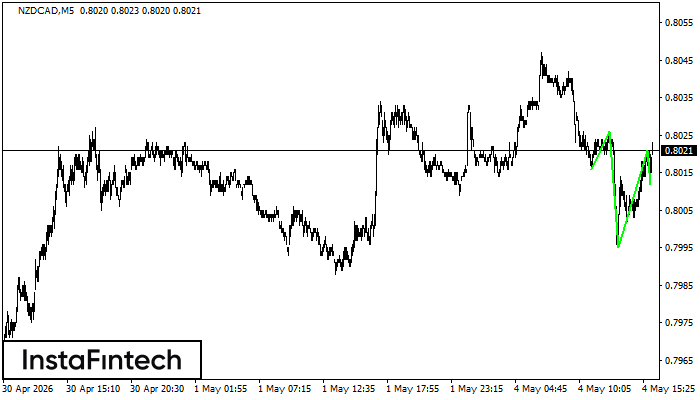
According to the chart of M5, NZDCAD formed the Inverse Head and Shoulder pattern. The Head’s top is set at 0.8021 while the median line of the Neck is found at 0.7995/0.8012. The formation of the Inverse Head and Shoulder pattern evidently signals a reversal of the downward trend. In other words, in case the scenario comes true, the price of NZDCAD will go towards 0.8036
NZDCAD M5
Double Top
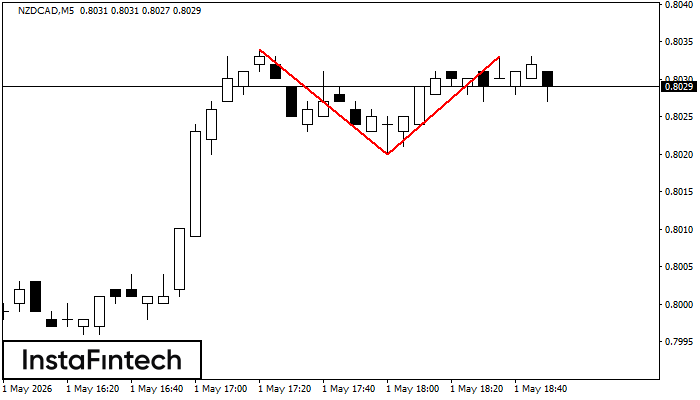
On the chart of NZDCAD M5 the Double Top reversal pattern has been formed. Characteristics: the upper boundary 0.8033; the lower boundary 0.8020; the width of the pattern 13 points. The signal: a break of the lower boundary will cause continuation of the downward trend targeting the 0.8005 level.
NZDCAD M15
Inverse Head and Shoulder
According to the chart of M15, NZDCAD produced the pattern termed the Inverse Head and Shoulder. The Head is fixed at 0.7988 while the median line of the Neck is set at 0.8006/0.8003. The formation of the Inverse Head and Shoulder Pattern clearly indicates a reversal of the downward trend. In means that in case the scenario comes true, the price of NZDCAD will go towards 0.8026.