 English
  Русский
 Bahasa Indonesia
 Bahasa Malay
 ไทย
ไทย Español
 Deutsch
 Български
 Français
 Tiếng Việt
 中文
中文 বাংলা
বাংলা हिन्दी
 Čeština
 Українська
 Română
FX.co ★ Patterns NZDJPY | New Zealand Dollar (NZD) to Japanese Yen (JPY) Rate in the Forex market

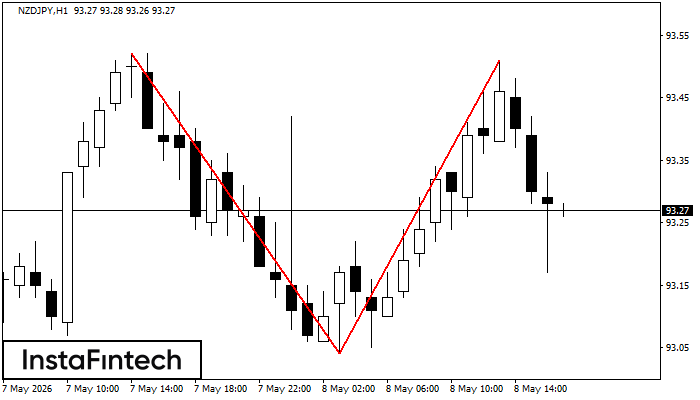
NZDJPY H1
Double Top
The Double Top pattern has been formed on NZDJPY H1. It signals that the trend has been changed from upwards to downwards. Probably, if the base of the pattern 93.04 is broken, the downward movement will continue.
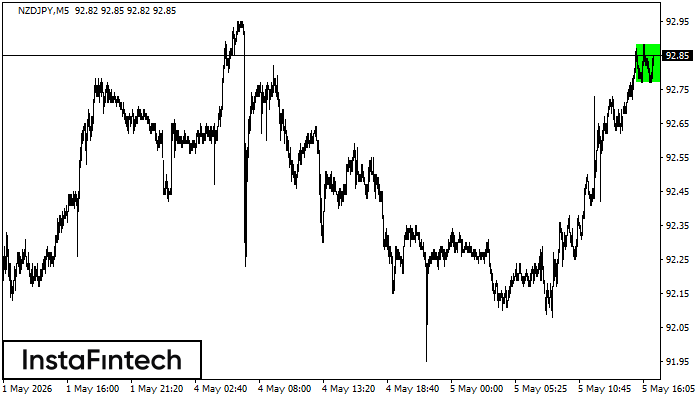
NZDJPY M5
Bullish Rectangle
According to the chart of M5, NZDJPY formed the Bullish Rectangle. This type of a pattern indicates a trend continuation. It consists of two levels: resistance 92.88 and support 92.77. In case the resistance level 92.88 - 92.88 is broken, the instrument is likely to follow the bullish trend.
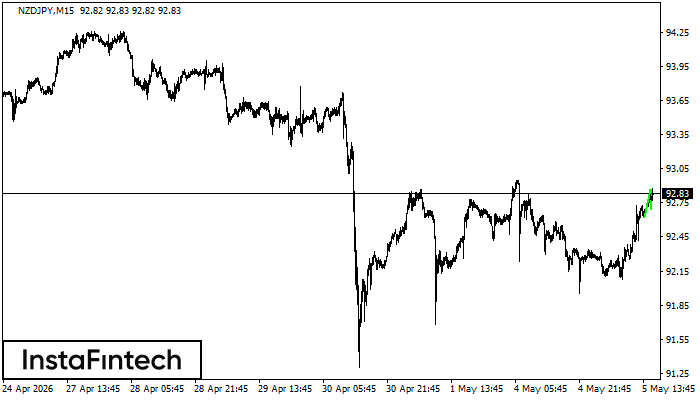
NZDJPY M15
Bullish Flag
The Bullish Flag pattern has been formed on the chart NZDJPY M15 which signals that the upward trend will continue. Signals: а break of the peak at 92.87 may push the price higher, and the rise will be the projection of the pole.
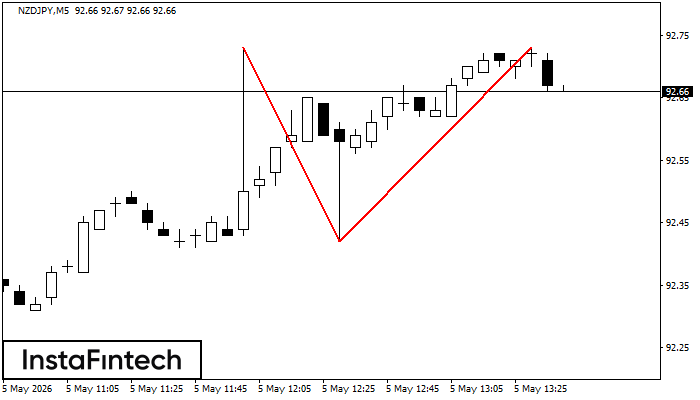
NZDJPY M5
Double Top
On the chart of NZDJPY M5 the Double Top reversal pattern has been formed. Characteristics: the upper boundary 92.73; the lower boundary 92.42; the width of the pattern 31 points. The signal: a break of the lower boundary will cause continuation of the downward trend targeting the 92.27 level.
NZDJPY M5
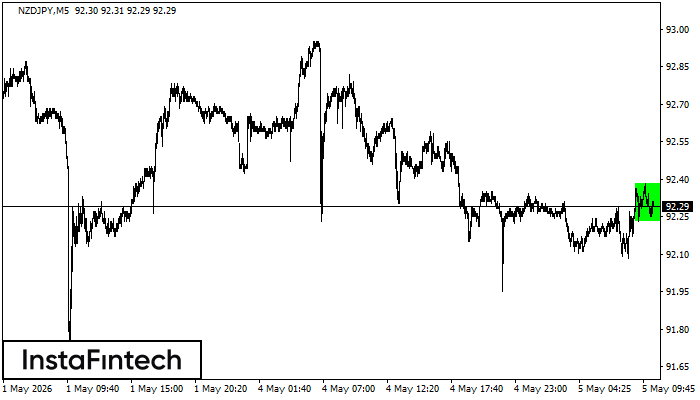
Bullish Rectangle
According to the chart of M5, NZDJPY formed the Bullish Rectangle. This type of a pattern indicates a trend continuation. It consists of two levels: resistance 92.38 and support 92.23. In case the resistance level 92.38 - 92.38 is broken, the instrument is likely to follow the bullish trend.
NZDJPY M30
Bullish Symmetrical Triangle
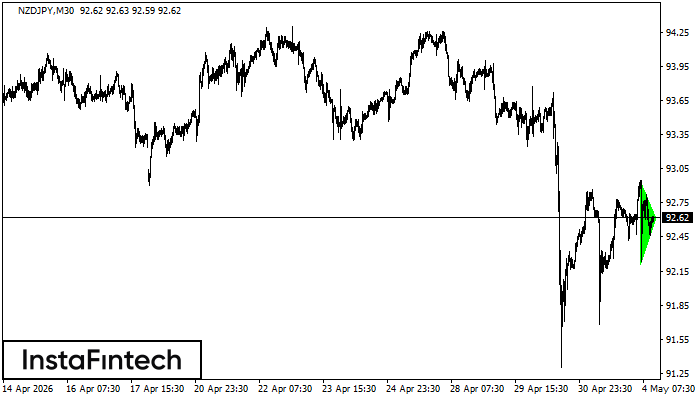
According to the chart of M30, NZDJPY formed the Bullish Symmetrical Triangle pattern. The lower border of the pattern touches the coordinates 92.20/92.61 whereas the upper border goes across 92.95/92.61. If the Bullish Symmetrical Triangle pattern is in progress, this evidently signals a further upward trend. In other words, in case the scenario comes true, the price of NZDJPY will breach the upper border to head for 92.91.
NZDJPY M15
Bullish Symmetrical Triangle
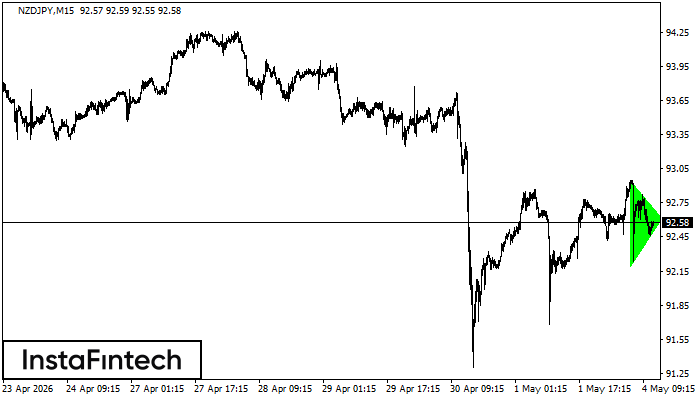
According to the chart of M15, NZDJPY formed the Bullish Symmetrical Triangle pattern, which signals the trend will continue. Description. The upper border of the pattern touches the coordinates 92.95/92.61 whereas the lower border goes across 92.19/92.61. The pattern width is measured on the chart at 76 pips. If the Bullish Symmetrical Triangle pattern is in progress during the upward trend, this indicates the current trend will go on. In case 92.61 is broken, the price could continue its move toward 92.83.
NZDJPY M5
Bearish pennant
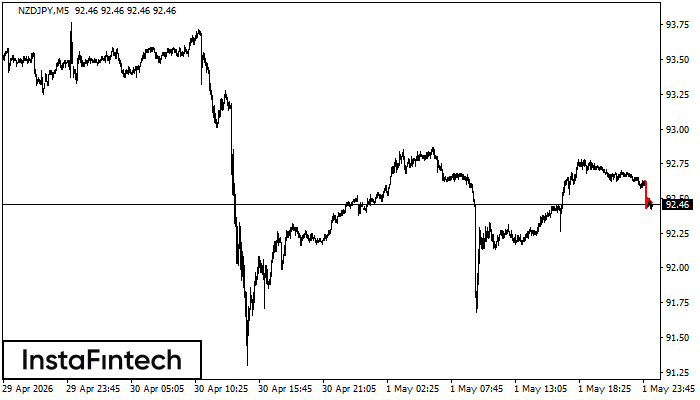
The Bearish pennant pattern has formed on the NZDJPY M5 chart. It signals potential continuation of the existing trend. Specifications: the pattern’s bottom has the coordinate of 92.43; the projection of the flagpole height is equal to 20 pips. In case the price breaks out the pattern’s bottom of 92.43, the downtrend is expected to continue for further level 92.28.
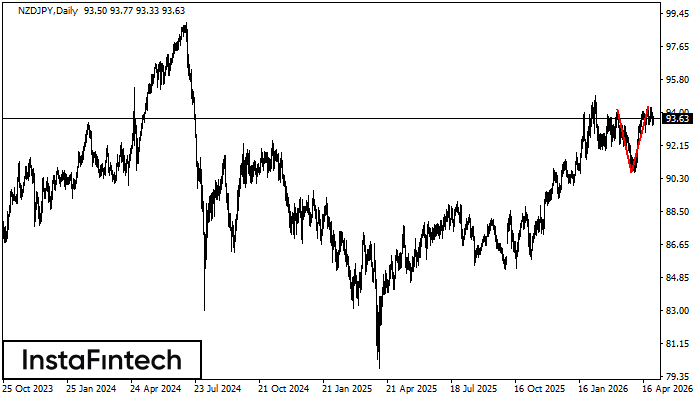
NZDJPY D1
Double Top
The Double Top reversal pattern has been formed on NZDJPY D1. Characteristics: the upper boundary 94.15; the lower boundary 90.64; the width of the pattern is 366 points. Sell trades are better to be opened below the lower boundary 90.64 with a possible movements towards the 90.24 level.
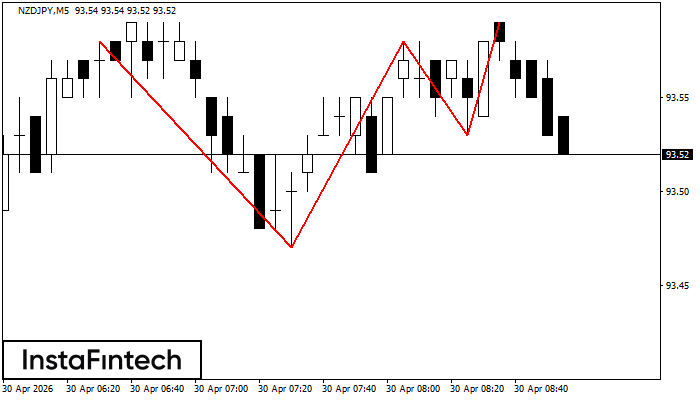
NZDJPY M5
Triple Top
The Triple Top pattern has formed on the chart of the NZDJPY M5. Features of the pattern: borders have an ascending angle; the lower line of the pattern has the coordinates 93.47/93.53 with the upper limit 93.58/93.59; the projection of the width is 11 points. The formation of the Triple Top figure most likely indicates a change in the trend from upward to downward. This means that in the event of a breakdown of the support level of 93.47, the price is most likely to continue the downward movement.