 English
  Русский
 Bahasa Indonesia
 Bahasa Malay
 ไทย
ไทย Español
 Deutsch
 Български
 Français
 Tiếng Việt
 中文
中文 বাংলা
বাংলা हिन्दी
 Čeština
 Українська
 Română
FX.co ★ Patterns NZDUSD | New Zealand Dollar (NZD) to US Dollar (USD) Rate in the Forex market

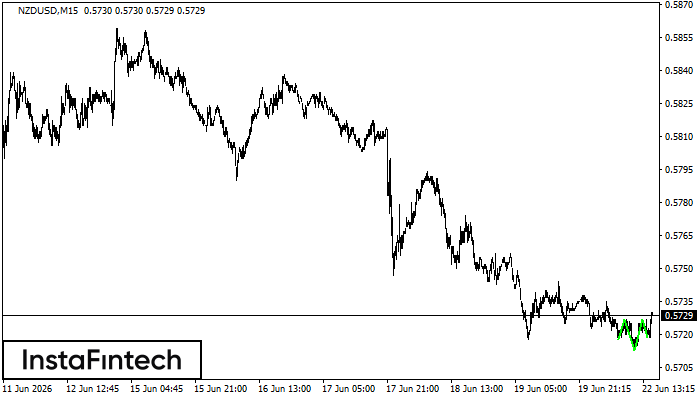
NZDUSD M15
Inverse Head and Shoulder
According to M15, NZDUSD is shaping the technical pattern – the Inverse Head and Shoulder. In case the Neckline 0.5727/0.5727 is broken out, the instrument is likely to move toward 0.5749.
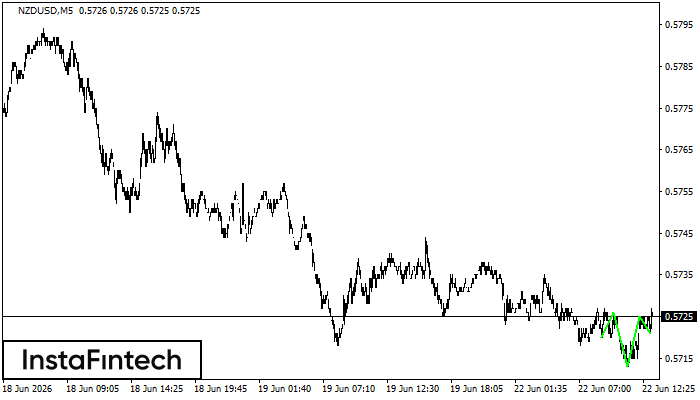
NZDUSD M5
Inverse Head and Shoulder
According to M5, NZDUSD is shaping the technical pattern – the Inverse Head and Shoulder. In case the Neckline 0.5726/0.5725 is broken out, the instrument is likely to move toward 0.5740.
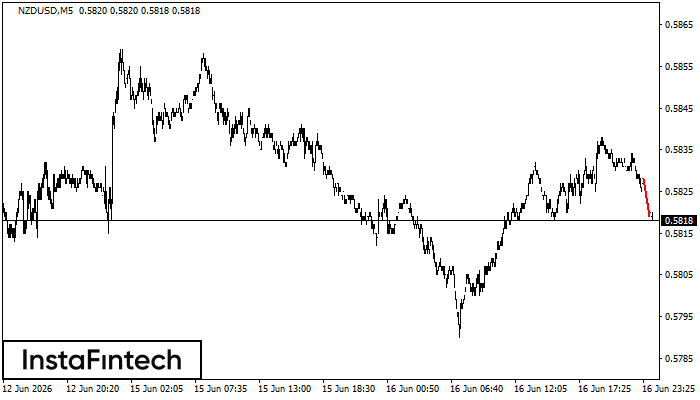
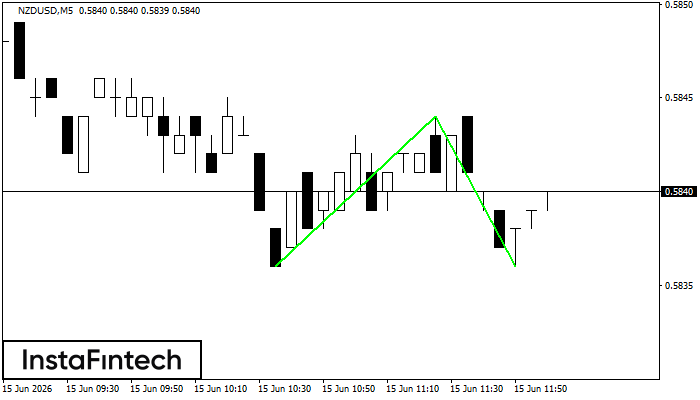
NZDUSD M5
Bearish Flag
The Bearish Flag pattern has been formed on the chart NZDUSD M5 which signals that the downward trend will continue. If the price breaks below the low at 0.5819, then it is most likely to move further downwards. The price will likely move by the number of points which equals the length of the flag pole (10 points).
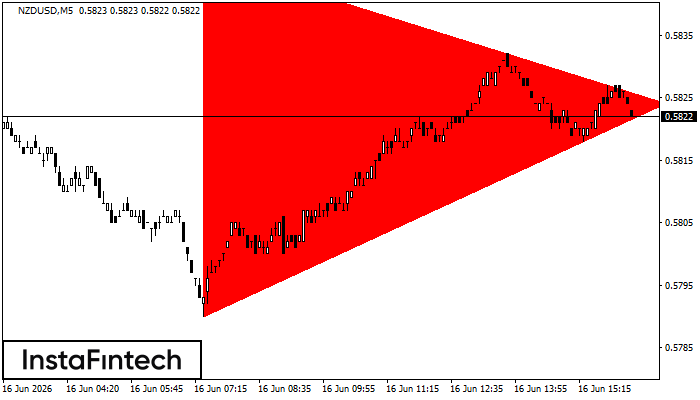
NZDUSD M5
Bearish Symmetrical Triangle
According to the chart of M5, NZDUSD formed the Bearish Symmetrical Triangle pattern. This pattern signals a further downward trend in case the lower border 0.5790 is breached. Here, a hypothetical profit will equal the width of the available pattern that is -57 pips.
NZDUSD M5
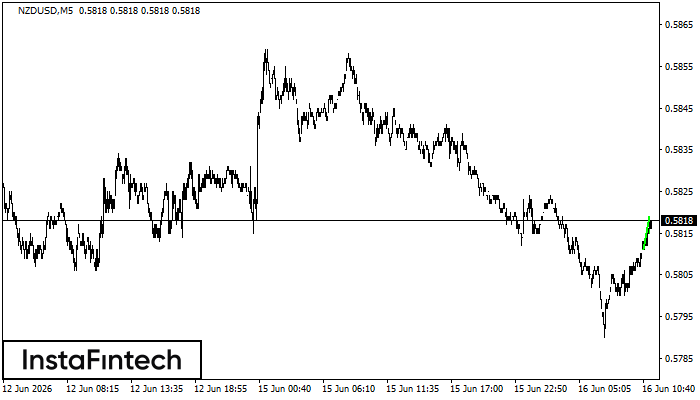
Bullish pennant
The Bullish pennant signal – Trading instrument NZDUSD M5, continuation pattern. Forecast: it is possible to set up a buy position above the pattern’s high of 0.5819, with the prospect of the next move being a projection of the flagpole height.
NZDUSD M5
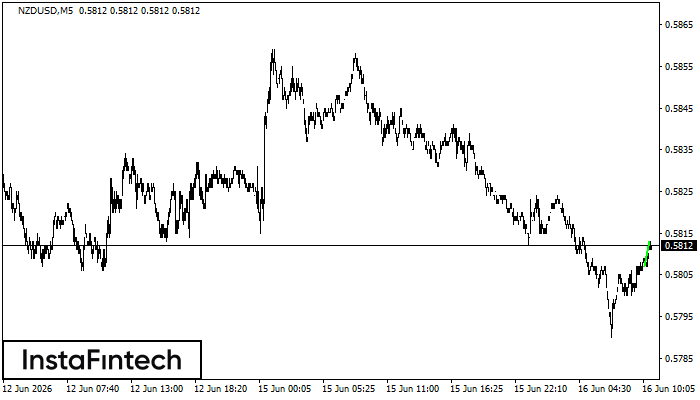
Bullish Flag
The Bullish Flag pattern which signals continuation of a trend has been formed on the chart NZDUSD M5. Forecast: if the price breaks above the pattern high at 0.5813, then traders will be able to place a long deal with the target at 0.5828.
NZDUSD M5
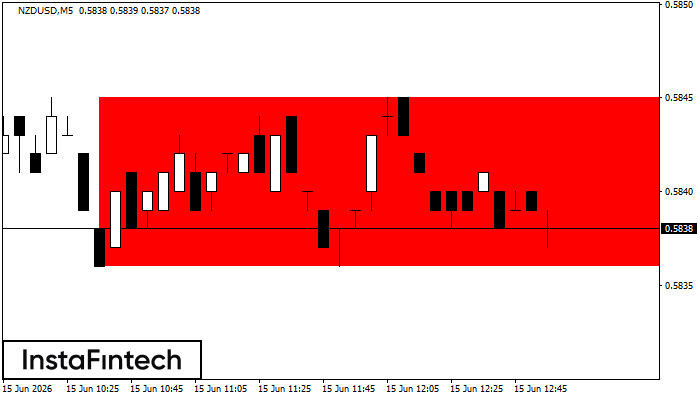
Bearish Rectangle
According to the chart of M5, NZDUSD formed the Bearish Rectangle. The pattern indicates a trend continuation. The upper border is 0.5845, the lower border is 0.5836. The signal means that a short position should be opened after fixing a price below the lower border 0.5836 of the Bearish Rectangle.
NZDUSD M5
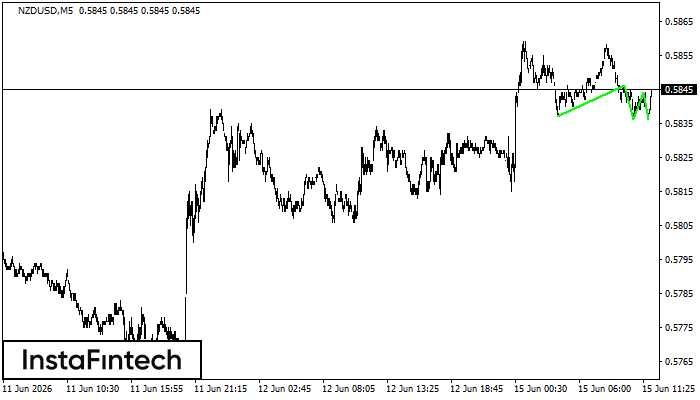
Triple Bottom
The Triple Bottom pattern has formed on the chart of the NZDUSD M5 trading instrument. The pattern signals a change in the trend from downwards to upwards in the case of breakdown of 0.5846/0.5844.
NZDUSD M5
Double Bottom
The Double Bottom pattern has been formed on NZDUSD M5. Characteristics: the support level 0.5836; the resistance level 0.5844; the width of the pattern 8 points. If the resistance level is broken, a change in the trend can be predicted with the first target point lying at the distance of 8 points.
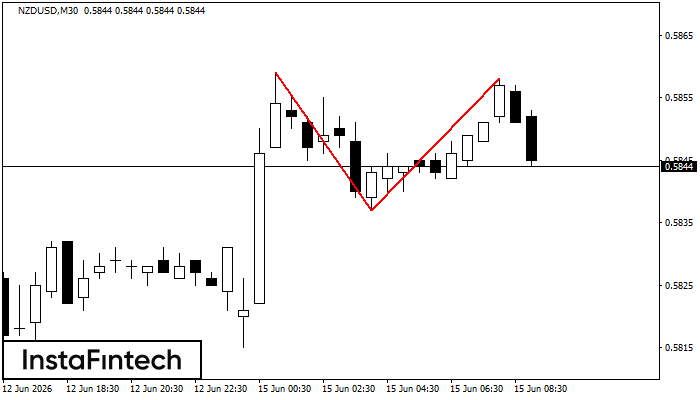
NZDUSD M30
Double Top
The Double Top reversal pattern has been formed on NZDUSD M30. Characteristics: the upper boundary 0.5859; the lower boundary 0.5837; the width of the pattern is 21 points. Sell trades are better to be opened below the lower boundary 0.5837 with a possible movements towards the 0.5807 level.