 English
  Русский
 Bahasa Indonesia
 Bahasa Malay
 ไทย
ไทย Español
 Deutsch
 Български
 Français
 Tiếng Việt
 中文
中文 বাংলা
বাংলা हिन्दी
 Čeština
 Українська
 Română
FX.co ★ Patterns #PEP | PepsiCo, Inc. Stock Price

#PEP M5
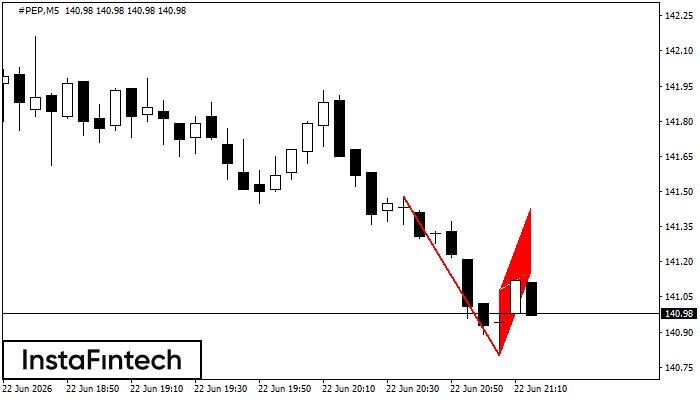
Bearish Flag
The Bearish Flag pattern has been formed on the chart #PEP M5. Therefore, the downwards trend is likely to continue in the nearest term. As soon as the price breaks below the low at 140.80, traders should enter the market.
#PEP M5
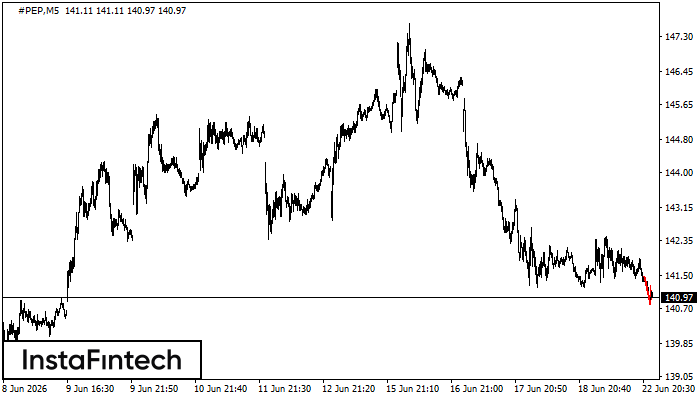
Bearish pennant
The Bearish pennant pattern has formed on the #PEP M5 chart. This pattern type is characterized by a slight slowdown after which the price will move in the direction of the original trend. In case the price fixes below the pattern’s low of 140.80, a trader will be able to successfully enter the sell position.
#PEP M5
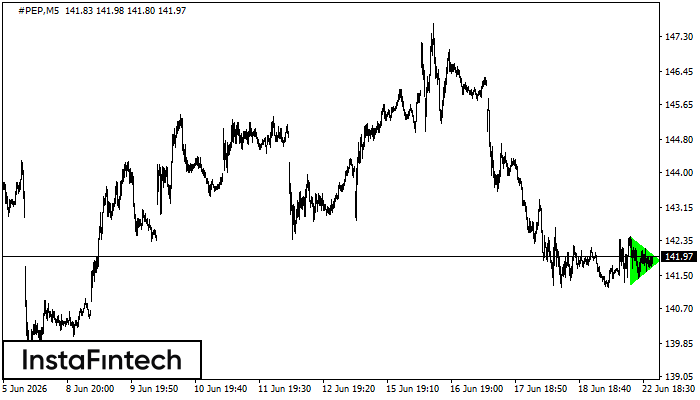
Bullish Symmetrical Triangle
According to the chart of M5, #PEP formed the Bullish Symmetrical Triangle pattern, which signals the trend will continue. Description. The upper border of the pattern touches the coordinates 142.45/141.88 whereas the lower border goes across 141.29/141.88. The pattern width is measured on the chart at 116 pips. If the Bullish Symmetrical Triangle pattern is in progress during the upward trend, this indicates the current trend will go on. In case 141.88 is broken, the price could continue its move toward 142.03.
#PEP M15
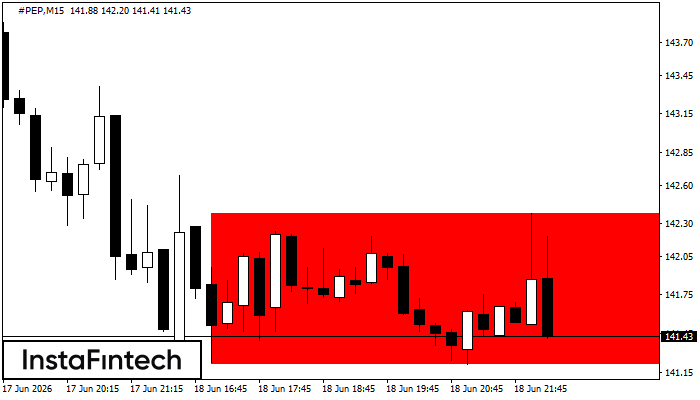
Bearish Rectangle
According to the chart of M15, #PEP formed the Bearish Rectangle. This type of a pattern indicates a trend continuation. It consists of two levels: resistance 142.38 - 0.00 and support 141.21 – 141.21. In case the resistance level 141.21 - 141.21 is broken, the instrument is likely to follow the bearish trend.
#PEP M30
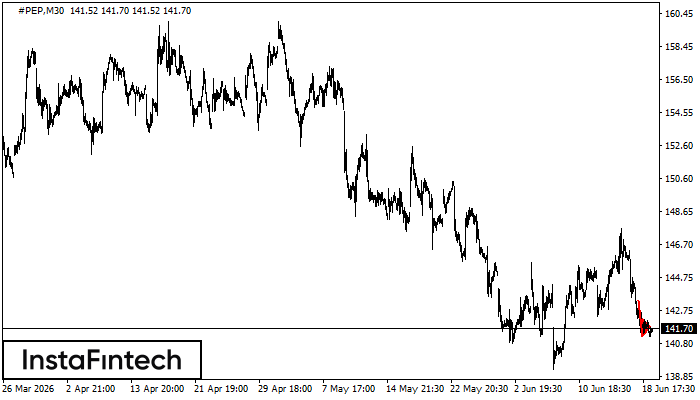
Bearish pennant
The Bearish pennant pattern has formed on the #PEP M30 chart. This pattern type is characterized by a slight slowdown after which the price will move in the direction of the original trend. In case the price fixes below the pattern’s low of 141.23, a trader will be able to successfully enter the sell position.
#PEP M15
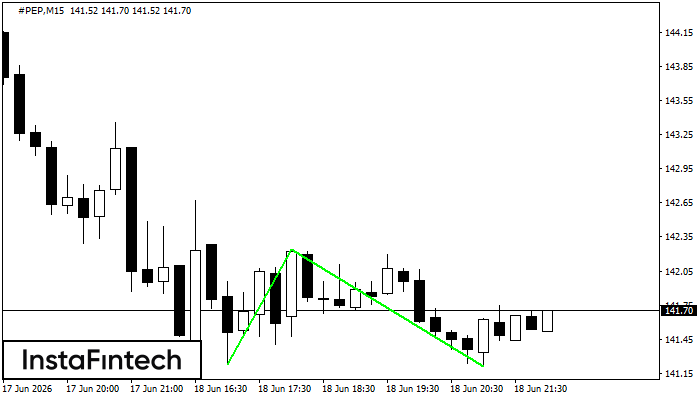
Double Bottom
The Double Bottom pattern has been formed on #PEP M15. Characteristics: the support level 141.23; the resistance level 142.24; the width of the pattern 101 points. If the resistance level is broken, a change in the trend can be predicted with the first target point lying at the distance of 103 points.
#PEP M15
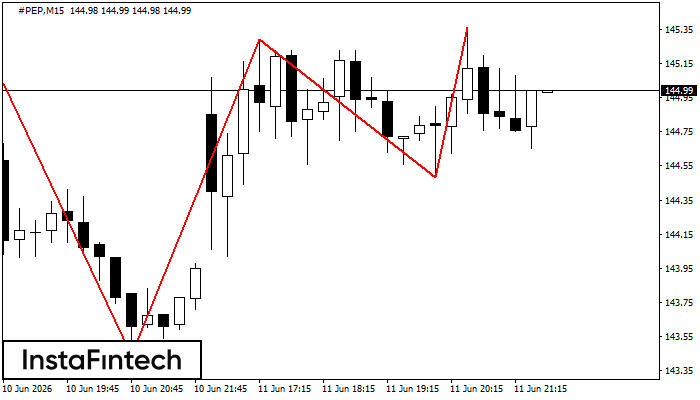
Triple Top
On the chart of the #PEP M15 trading instrument, the Triple Top pattern that signals a trend change has formed. It is possible that after formation of the third peak, the price will try to break through the resistance level 143.44, where we advise to open a trading position for sale. Take profit is the projection of the pattern’s width, which is 199 points.
#PEP M5
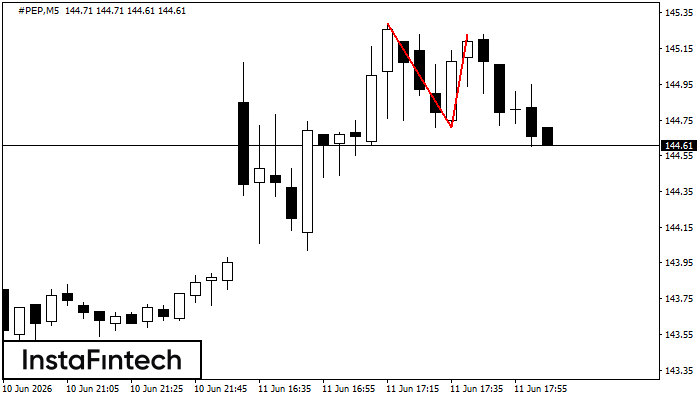
Double Top
The Double Top pattern has been formed on #PEP M5. It signals that the trend has been changed from upwards to downwards. Probably, if the base of the pattern 144.71 is broken, the downward movement will continue.
#PEP M5
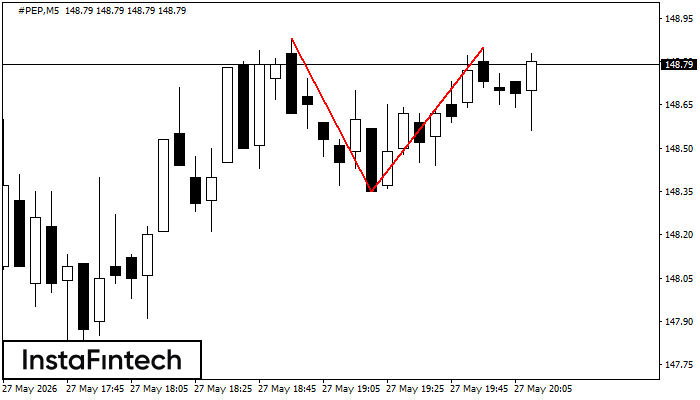
Double Bottom
The Double Bottom pattern has been formed on #PEP M5. This formation signals a reversal of the trend from downwards to upwards. The signal is that a buy trade should be opened after the upper boundary of the pattern 145.16 is broken. The further movements will rely on the width of the current pattern 157 points.
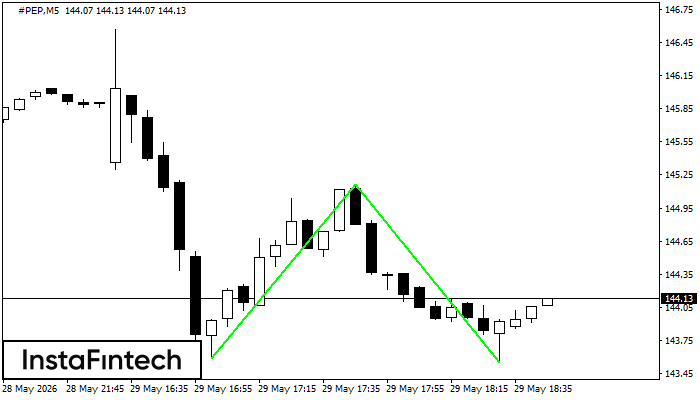
#PEP M5
Double Top
The Double Top pattern has been formed on #PEP M5. It signals that the trend has been changed from upwards to downwards. Probably, if the base of the pattern 148.35 is broken, the downward movement will continue.