 English
  Русский
 Bahasa Indonesia
 Bahasa Malay
 ไทย
ไทย Español
 Deutsch
 Български
 Français
 Tiếng Việt
 中文
中文 বাংলা
বাংলা हिन्दी
 Čeština
 Українська
 Română
FX.co ★ Patterns #TSLA | Tesla, Inc. Stock Price

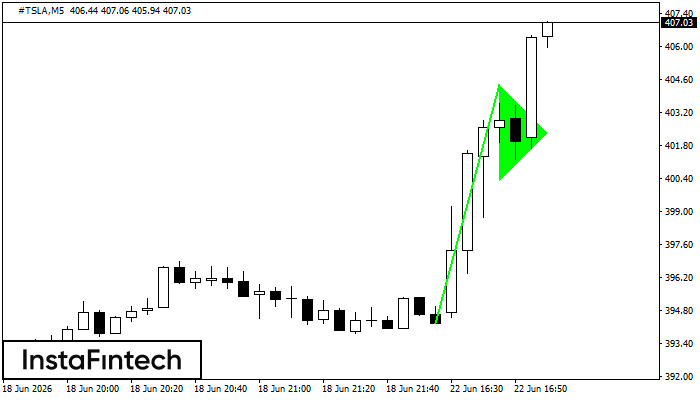
#TSLA M5
Bullish pennant
The Bullish pennant signal – Trading instrument #TSLA M5, continuation pattern. Forecast: it is possible to set up a buy position above the pattern’s high of 404.40, with the prospect of the next move being a projection of the flagpole height.
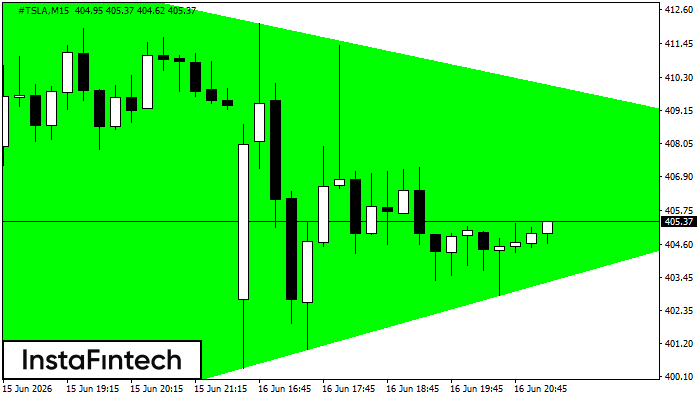
#TSLA M15
Bullish Symmetrical Triangle
According to the chart of M15, #TSLA formed the Bullish Symmetrical Triangle pattern, which signals the trend will continue. Description. The upper border of the pattern touches the coordinates 414.81/407.16 whereas the lower border goes across 396.97/407.16. The pattern width is measured on the chart at 1784 pips. If the Bullish Symmetrical Triangle pattern is in progress during the upward trend, this indicates the current trend will go on. In case 407.16 is broken, the price could continue its move toward 407.39.
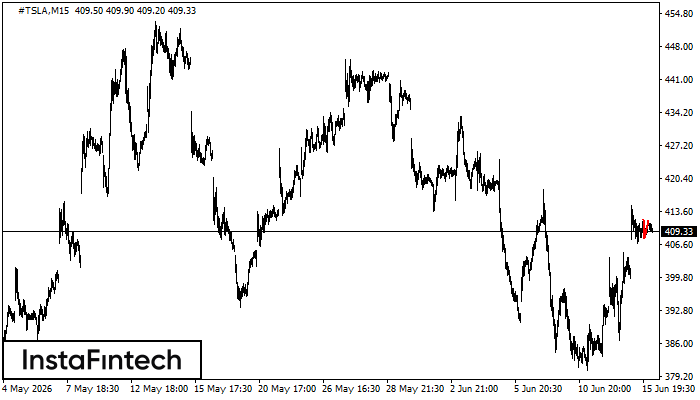
#TSLA M15
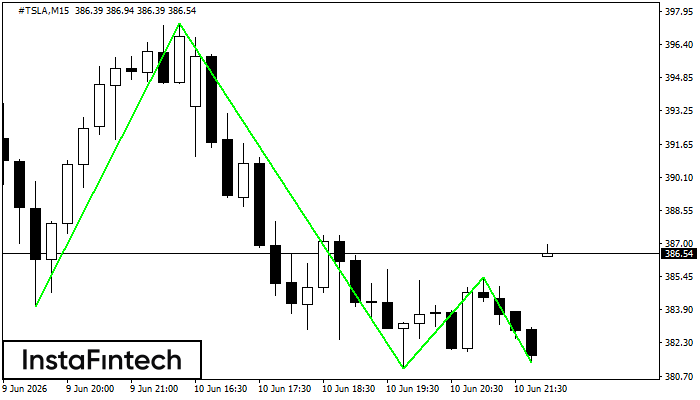
Double Top
The Double Top pattern has been formed on #TSLA M15. It signals that the trend has been changed from upwards to downwards. Probably, if the base of the pattern 407.85 is broken, the downward movement will continue.
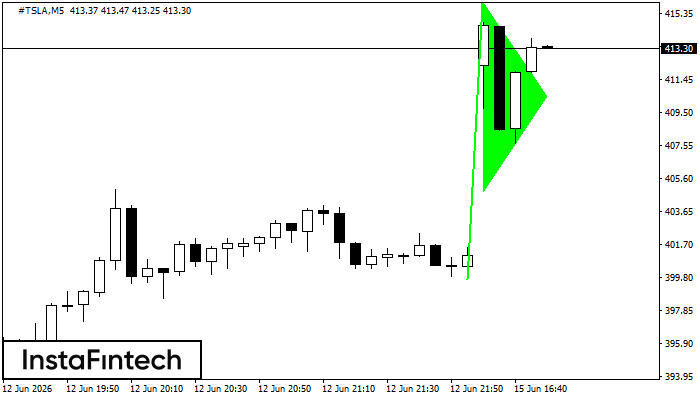
#TSLA M5
Bullish pennant
The Bullish pennant signal – Trading instrument #TSLA M5, continuation pattern. Forecast: it is possible to set up a buy position above the pattern’s high of 415.99, with the prospect of the next move being a projection of the flagpole height.
#TSLA M15
Triple Bottom
The Triple Bottom pattern has formed on the chart of #TSLA M15. Features of the pattern: The lower line of the pattern has coordinates 397.39 with the upper limit 397.39/385.37, the projection of the width is 1335 points. The formation of the Triple Bottom pattern most likely indicates a change in the trend from downward to upward. This means that in the event of a breakdown of the resistance level 384.04, the price is most likely to continue the upward movement.
#TSLA M5
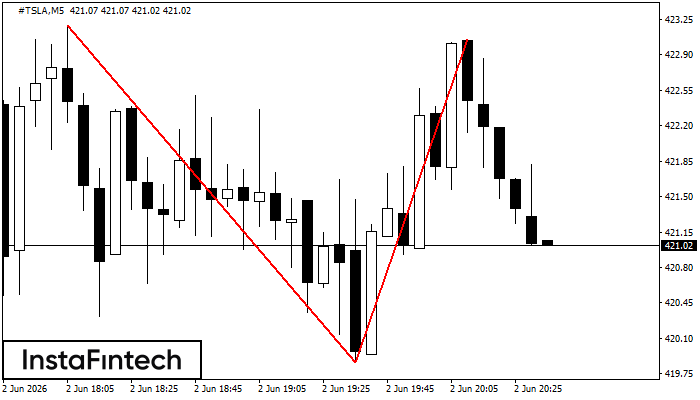
Double Top
On the chart of #TSLA M5 the Double Top reversal pattern has been formed. Characteristics: the upper boundary 423.05; the lower boundary 419.86; the width of the pattern 319 points. The signal: a break of the lower boundary will cause continuation of the downward trend targeting the 419.71 level.
#TSLA M5
Bullish Symmetrical Triangle
According to the chart of M5, #TSLA formed the Bullish Symmetrical Triangle pattern. The lower border of the pattern touches the coordinates 440.25/441.62 whereas the upper border goes across 442.87/441.62. If the Bullish Symmetrical Triangle pattern is in progress, this evidently signals a further upward trend. In other words, in case the scenario comes true, the price of #TSLA will breach the upper border to head for 441.77.
#TSLA M5
Triple Top
The Triple Top pattern has formed on the chart of the #TSLA M5. Features of the pattern: borders have an ascending angle; the lower line of the pattern has the coordinates 440.46/440.88 with the upper limit 442.70/442.46; the projection of the width is 224 points. The formation of the Triple Top figure most likely indicates a change in the trend from upward to downward. This means that in the event of a breakdown of the support level of 440.46, the price is most likely to continue the downward movement.
#TSLA M5
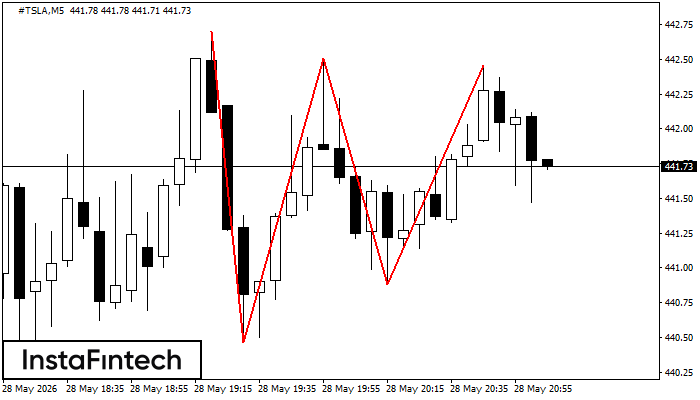
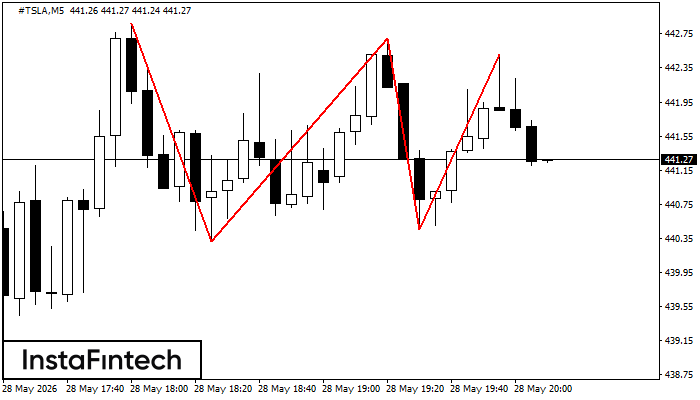
Triple Top
The Triple Top pattern has formed on the chart of the #TSLA M5. Features of the pattern: borders have an ascending angle; the lower line of the pattern has the coordinates 440.31/440.46 with the upper limit 442.87/442.51; the projection of the width is 256 points. The formation of the Triple Top figure most likely indicates a change in the trend from upward to downward. This means that in the event of a breakdown of the support level of 440.31, the price is most likely to continue the downward movement.
#TSLA M5
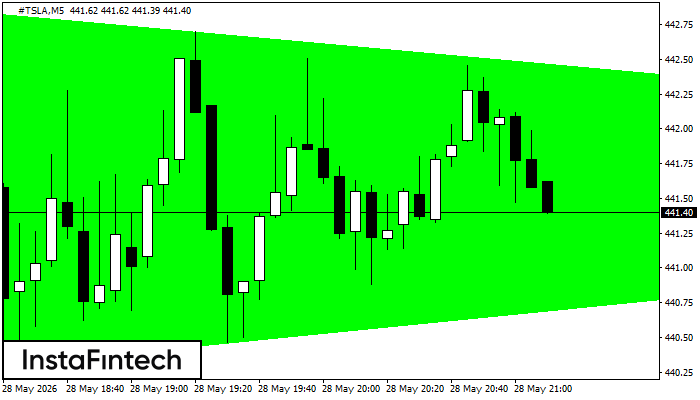
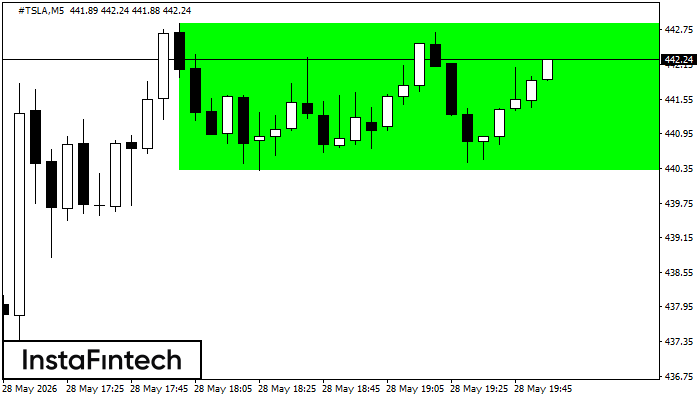
Bullish Rectangle
According to the chart of M5, #TSLA formed the Bullish Rectangle which is a pattern of a trend continuation. The pattern is contained within the following borders: the lower border 440.31 – 440.31 and upper border 442.87 – 442.87. In case the upper border is broken, the instrument is likely to follow the upward trend.