 English
  Русский
 Bahasa Indonesia
 Bahasa Malay
 ไทย
ไทย Español
 Deutsch
 Български
 Français
 Tiếng Việt
 中文
中文 বাংলা
বাংলা हिन्दी
 Čeština
 Українська
 Română
FX.co ★ Patterns USDJPY | US Dollar (USD) to Japanese Yen (JPY) Rate in the Forex market

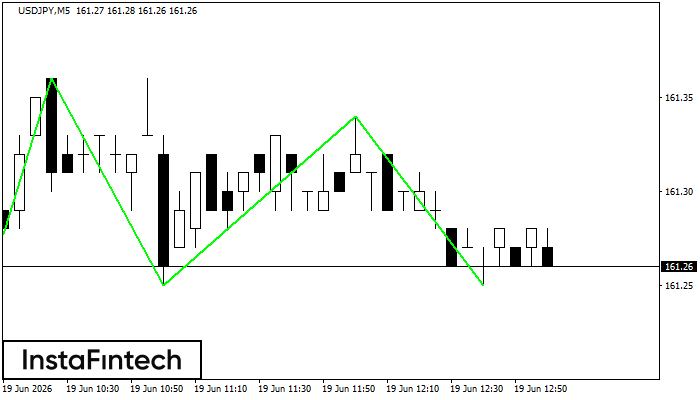
USDJPY M5
Triple Bottom
The Triple Bottom pattern has formed on the chart of USDJPY M5. Features of the pattern: The lower line of the pattern has coordinates 161.36 with the upper limit 161.36/161.34, the projection of the width is 11 points. The formation of the Triple Bottom pattern most likely indicates a change in the trend from downward to upward. This means that in the event of a breakdown of the resistance level 161.25, the price is most likely to continue the upward movement.
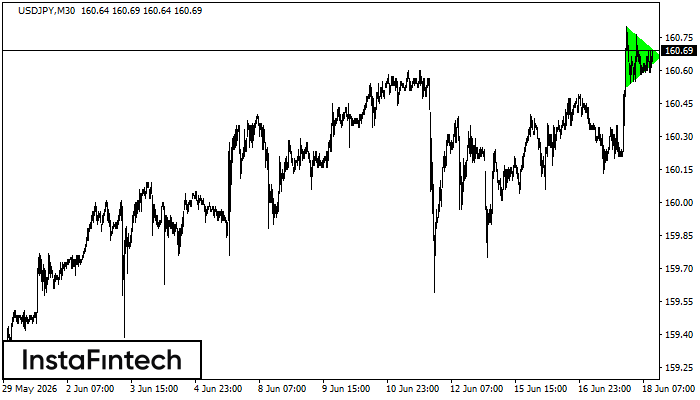
USDJPY M30
Bullish Symmetrical Triangle
According to the chart of M30, USDJPY formed the Bullish Symmetrical Triangle pattern. Description: This is the pattern of a trend continuation. 160.80 and 160.52 are the coordinates of the upper and lower borders respectively. The pattern width is measured on the chart at 28 pips. Outlook: If the upper border 160.80 is broken, the price is likely to continue its move by 160.96.
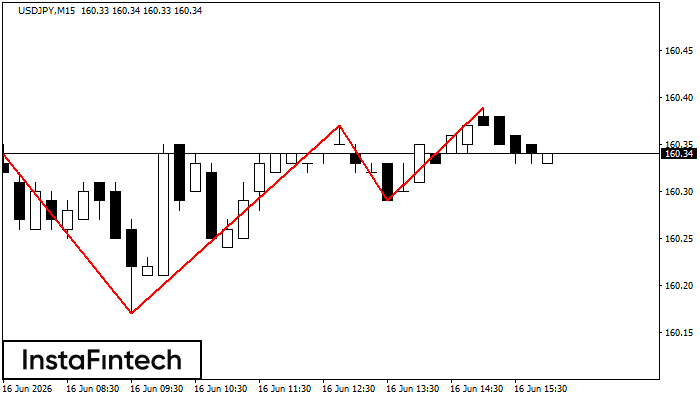
USDJPY M15
Triple Top
On the chart of the USDJPY M15 trading instrument, the Triple Top pattern that signals a trend change has formed. It is possible that after formation of the third peak, the price will try to break through the resistance level 160.17, where we advise to open a trading position for sale. Take profit is the projection of the pattern’s width, which is 19 points.
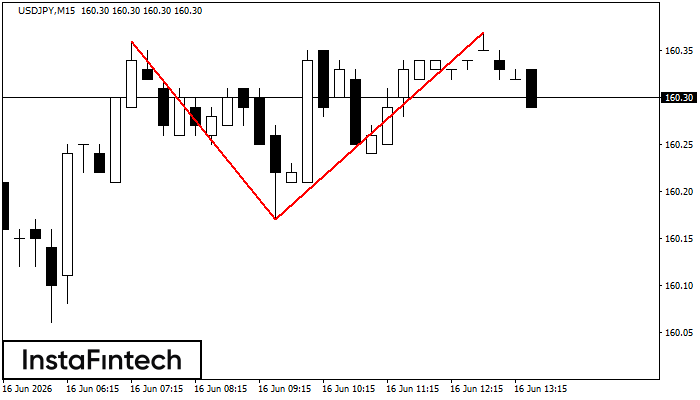
USDJPY M15
Double Top
On the chart of USDJPY M15 the Double Top reversal pattern has been formed. Characteristics: the upper boundary 160.37; the lower boundary 160.17; the width of the pattern 20 points. The signal: a break of the lower boundary will cause continuation of the downward trend targeting the 159.95 level.
USDJPY M15
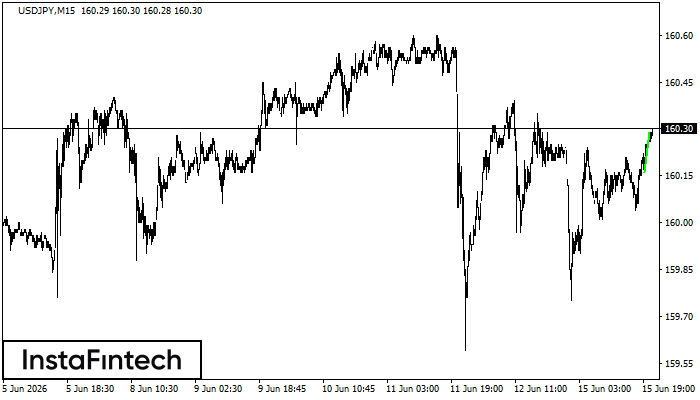
Bullish Flag
The Bullish Flag pattern which signals continuation of a trend has been formed on the chart USDJPY M15. Forecast: if the price breaks above the pattern high at 160.29, then traders will be able to place a long deal with the target at 160.51.
USDJPY H1
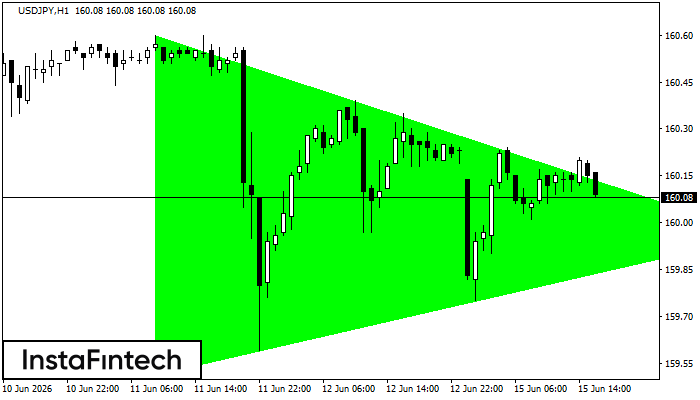
Bullish Symmetrical Triangle
According to the chart of H1, USDJPY formed the Bullish Symmetrical Triangle pattern. Description: This is the pattern of a trend continuation. 160.60 and 159.51 are the coordinates of the upper and lower borders respectively. The pattern width is measured on the chart at 109 pips. Outlook: If the upper border 160.60 is broken, the price is likely to continue its move by 160.36.
USDJPY M5
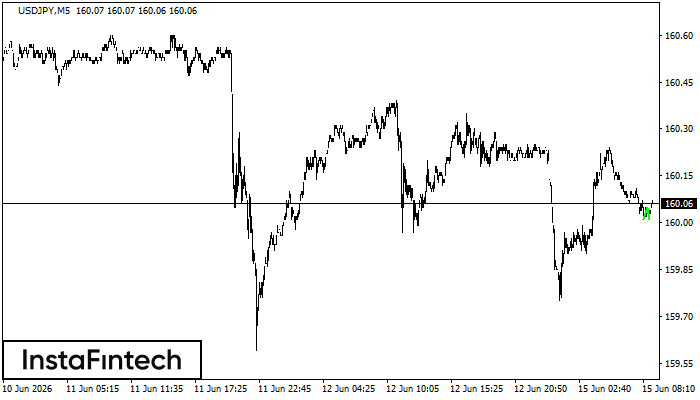
Double Bottom
The Double Bottom pattern has been formed on USDJPY M5; the upper boundary is 160.05; the lower boundary is 160.01. The width of the pattern is 4 points. In case of a break of the upper boundary 160.05, a change in the trend can be predicted where the width of the pattern will coincide with the distance to a possible take profit level.
USDJPY M15
Bearish Flag
The Bearish Flag pattern has been formed on the chart USDJPY M15 which signals that the downward trend will continue. If the price breaks below the low at 159.75, then it is most likely to move further downwards. The price will likely move by the number of points which equals the length of the flag pole (15 points).
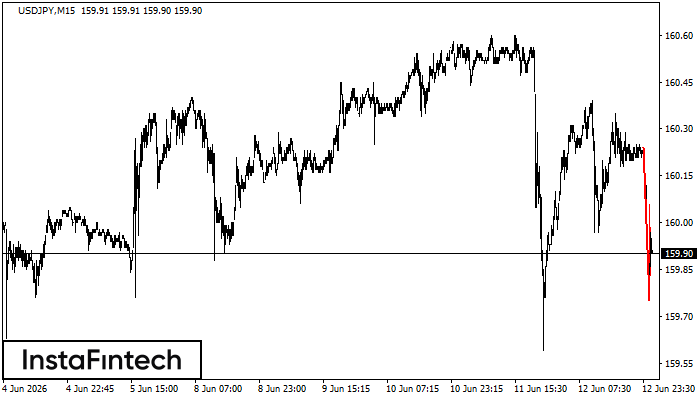
USDJPY M15
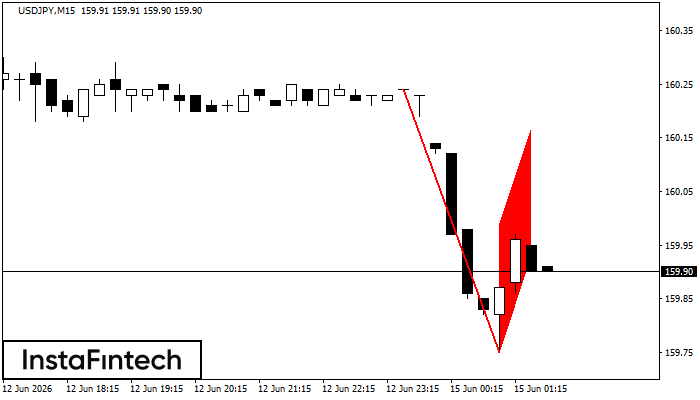
Bearish pennant
The Bearish pennant pattern has formed on the USDJPY M15 chart. This pattern type is characterized by a slight slowdown after which the price will move in the direction of the original trend. In case the price fixes below the pattern’s low of 159.75, a trader will be able to successfully enter the sell position.
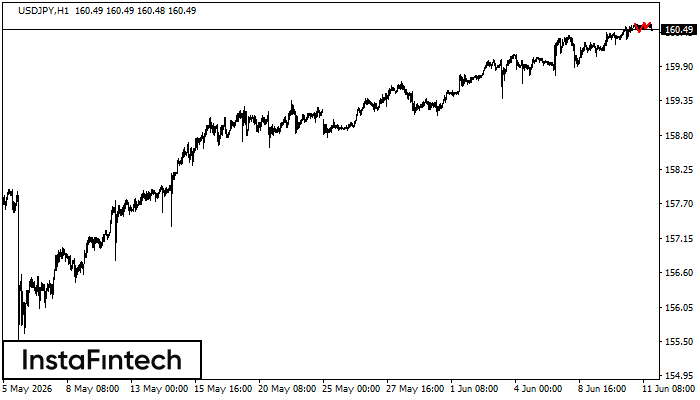
USDJPY H1
Triple Top
On the chart of the USDJPY H1 trading instrument, the Triple Top pattern that signals a trend change has formed. It is possible that after formation of the third peak, the price will try to break through the resistance level 160.44, where we advise to open a trading position for sale. Take profit is the projection of the pattern’s width, which is 14 points.