 Français
  Русский
 English
 Bahasa Indonesia
 Bahasa Malay
 ไทย
ไทย Español
 Deutsch
 Български
 Tiếng Việt
 中文
中文 বাংলা
বাংলা हिन्दी
 Čeština
 Українська
 Română
FX.co ★ Patterns #FB | Facebook, Inc. Stock Price

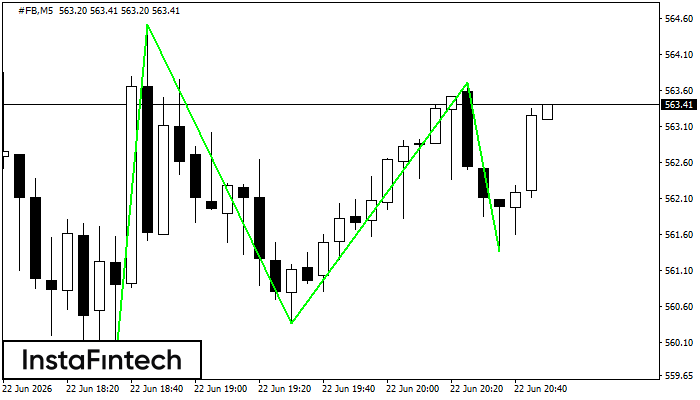
#FB M5
Triple Bottom
The Triple Bottom pattern has formed on the chart of the #FB M5 trading instrument. The pattern signals a change in the trend from downwards to upwards in the case of breakdown of 564.51/563.71.
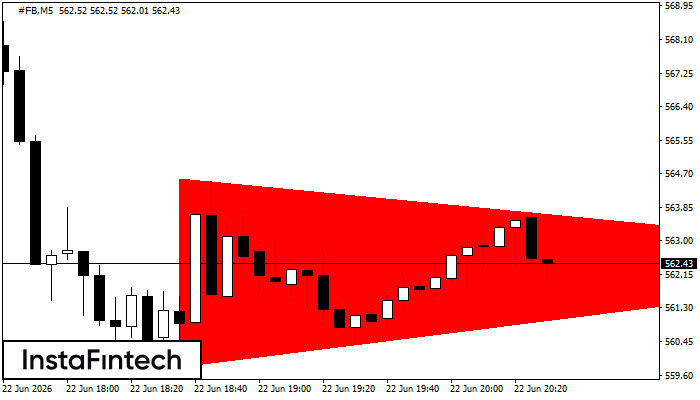
#FB M5
Bearish Symmetrical Triangle
According to the chart of M5, #FB formed the Bearish Symmetrical Triangle pattern. Trading recommendations: A breach of the lower border 559.81 is likely to encourage a continuation of the downward trend.

#FB M15
Bullish Flag
The Bullish Flag pattern which signals continuation of a trend has been formed on the chart #FB M15. Forecast: if the price breaks above the pattern high at 594.26, then traders will be able to place a long deal with the target at 594.48.
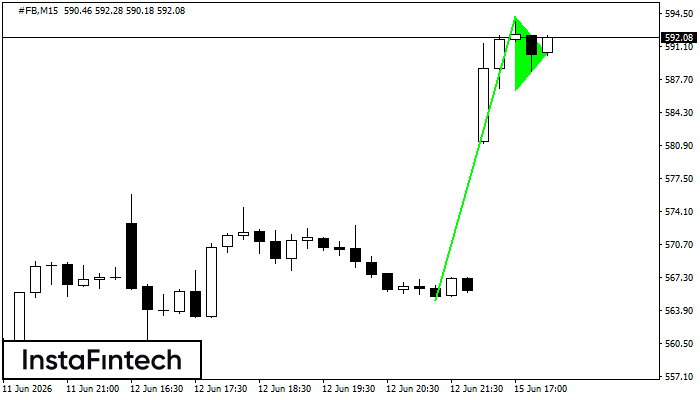
#FB M15
Bullish pennant
The Bullish pennant signal – Trading instrument #FB M15, continuation pattern. Forecast: it is possible to set up a buy position above the pattern’s high of 594.26, with the prospect of the next move being a projection of the flagpole height.
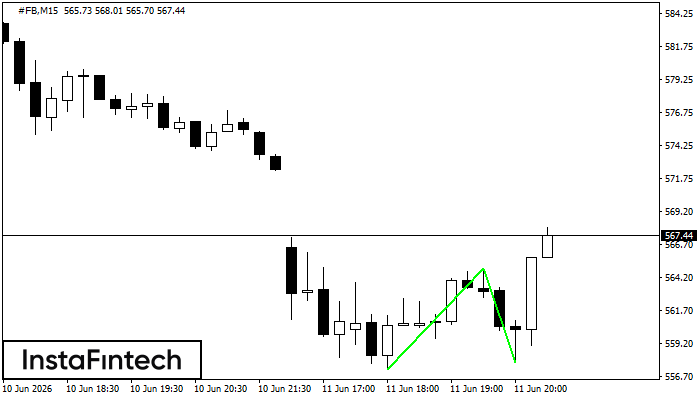
#FB M15
Double Bottom
The Double Bottom pattern has been formed on #FB M15. This formation signals a reversal of the trend from downwards to upwards. The signal is that a buy trade should be opened after the upper boundary of the pattern 564.90 is broken. The further movements will rely on the width of the current pattern 765 points.
#FB M5
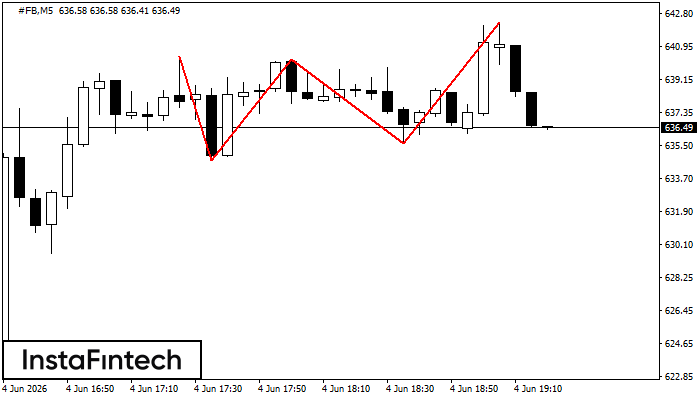
Triple Top
The Triple Top pattern has formed on the chart of the #FB M5. Features of the pattern: borders have an ascending angle; the lower line of the pattern has the coordinates 634.71/635.61 with the upper limit 640.39/642.27; the projection of the width is 568 points. The formation of the Triple Top figure most likely indicates a change in the trend from upward to downward. This means that in the event of a breakdown of the support level of 634.71, the price is most likely to continue the downward movement.
#FB M5
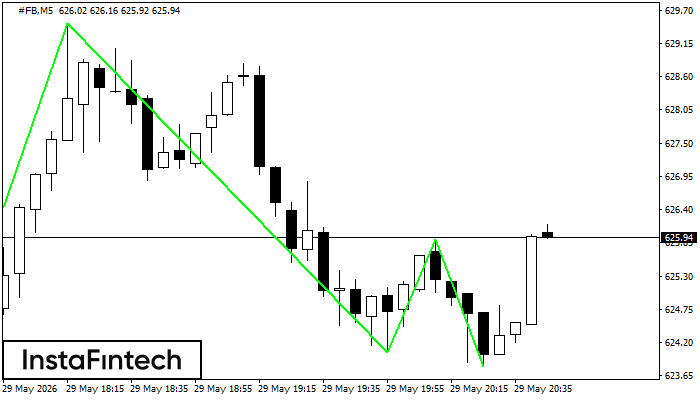
Triple Bottom
The Triple Bottom pattern has formed on the chart of #FB M5. Features of the pattern: The lower line of the pattern has coordinates 629.47 with the upper limit 629.47/625.90, the projection of the width is 607 points. The formation of the Triple Bottom pattern most likely indicates a change in the trend from downward to upward. This means that in the event of a breakdown of the resistance level 623.40, the price is most likely to continue the upward movement.
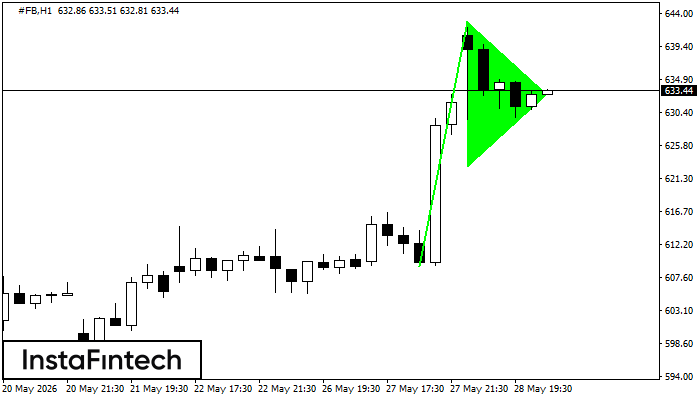
#FB H1
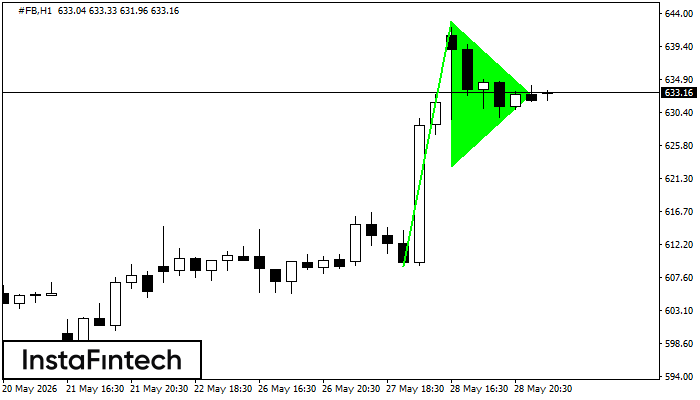
Bullish pennant
The Bullish pennant signal – Trading instrument #FB H1, continuation pattern. Forecast: it is possible to set up a buy position above the pattern’s high of 642.84, with the prospect of the next move being a projection of the flagpole height.
#FB M30
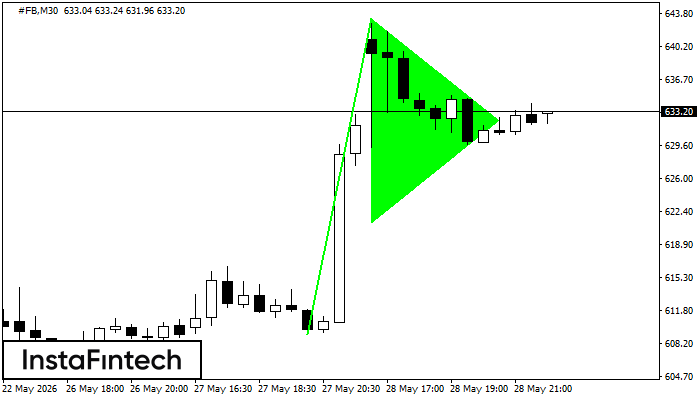
Bullish pennant
The Bullish pennant pattern is formed on the #FB M30 chart. It is a type of the continuation pattern. Supposedly, in case the price is fixed above the pennant’s high of 643.25, a further uptrend is possible.
#FB H1
Bullish pennant
The Bullish pennant signal – Trading instrument #FB H1, continuation pattern. Forecast: it is possible to set up a buy position above the pattern’s high of 642.84, with the prospect of the next move being a projection of the flagpole height.