 Français
  Русский
 English
 Bahasa Indonesia
 Bahasa Malay
 ไทย
ไทย Español
 Deutsch
 Български
 Tiếng Việt
 中文
中文 বাংলা
বাংলা हिन्दी
 Čeština
 Українська
 Română
FX.co ★ Patterns NZDJPY | New Zealand Dollar (NZD) to Japanese Yen (JPY) Rate in the Forex market

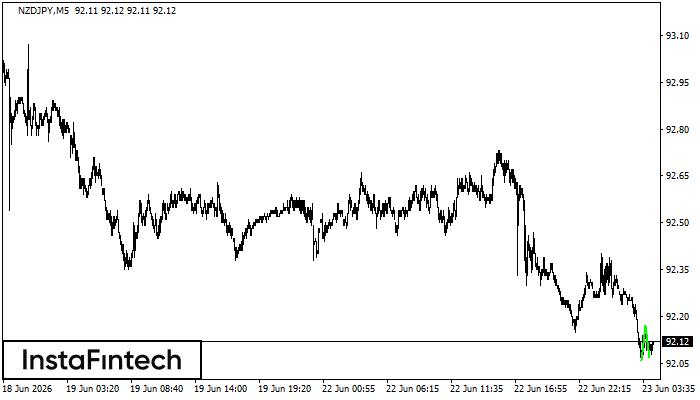
NZDJPY M5
Double Bottom
The Double Bottom pattern has been formed on NZDJPY M5. This formation signals a reversal of the trend from downwards to upwards. The signal is that a buy trade should be opened after the upper boundary of the pattern 92.17 is broken. The further movements will rely on the width of the current pattern 11 points.
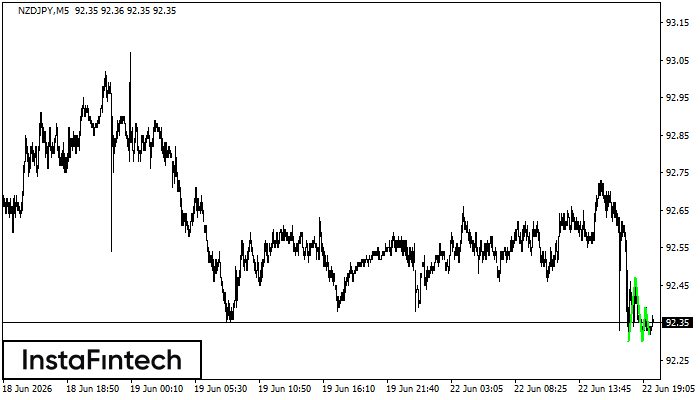
NZDJPY M5
Triple Bottom
The Triple Bottom pattern has formed on the chart of NZDJPY M5. Features of the pattern: The lower line of the pattern has coordinates 92.47 with the upper limit 92.47/92.39, the projection of the width is 17 points. The formation of the Triple Bottom pattern most likely indicates a change in the trend from downward to upward. This means that in the event of a breakdown of the resistance level 92.30, the price is most likely to continue the upward movement.
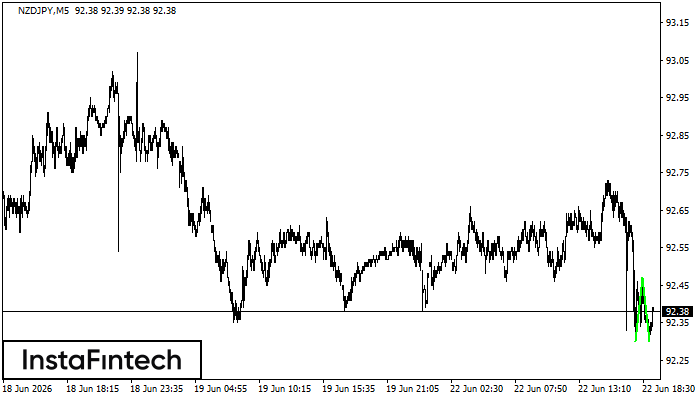
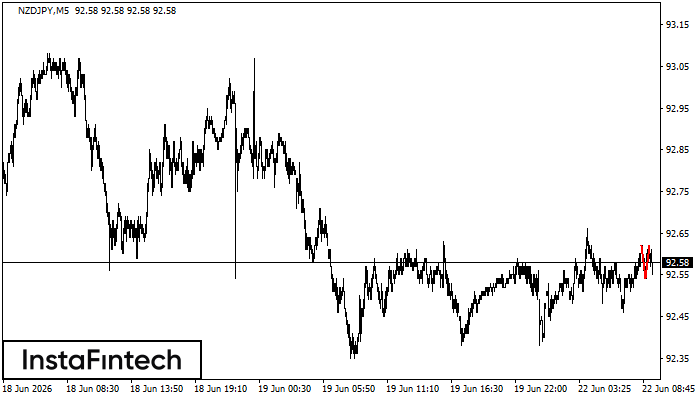
NZDJPY M5
Double Bottom
The Double Bottom pattern has been formed on NZDJPY M5. This formation signals a reversal of the trend from downwards to upwards. The signal is that a buy trade should be opened after the upper boundary of the pattern 92.47 is broken. The further movements will rely on the width of the current pattern 17 points.
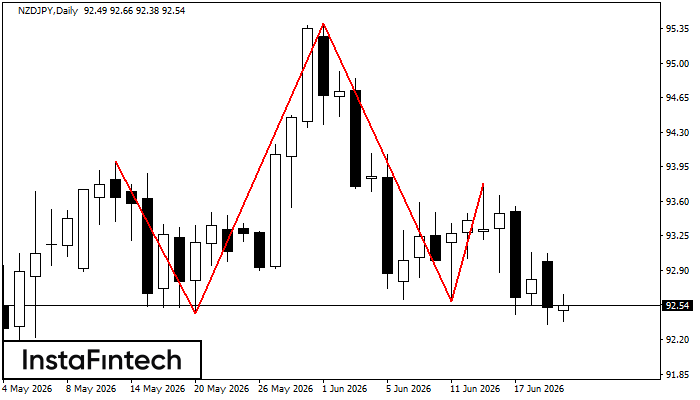
NZDJPY D1
Head and Shoulders
The technical pattern called Head and Shoulders has appeared on the chart of NZDJPY D1. There are weighty reasons to suggest that the price will surpass the Neckline 92.46/92.59 after the right shoulder has been formed. So, the trend is set to change with the price heading for 92.19.
NZDJPY M5
Double Top
On the chart of NZDJPY M5 the Double Top reversal pattern has been formed. Characteristics: the upper boundary 92.62; the lower boundary 92.54; the width of the pattern 8 points. The signal: a break of the lower boundary will cause continuation of the downward trend targeting the 92.39 level.
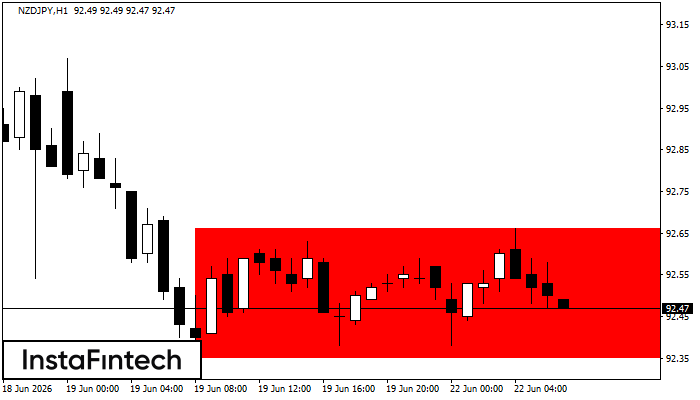
NZDJPY H1
Bearish Rectangle
According to the chart of H1, NZDJPY formed the Bearish Rectangle which is a pattern of a trend continuation. The pattern is contained within the following borders: lower border 92.35 – 92.35 and upper border 92.66 – 92.66. In case the lower border is broken, the instrument is likely to follow the downward trend.
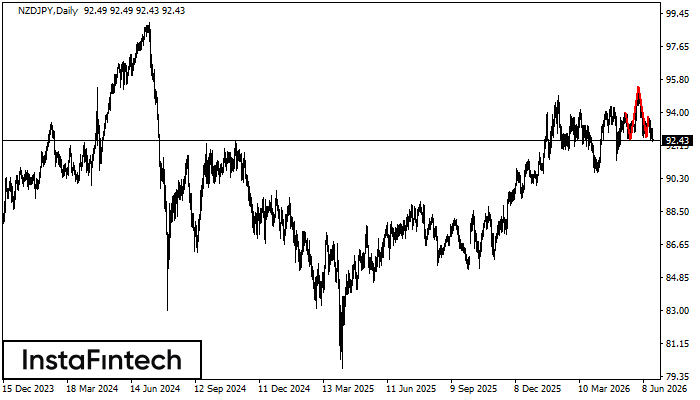
NZDJPY D1
Head and Shoulders
The NZDJPY D1 formed the Head and Shoulders pattern with the following features: The Head’s top is at 95.40, the Neckline and the upward angle are at 92.46/92.59. The formation of this pattern can bring about changes in the current trend from bullish to bearish. In case the pattern triggers the expected changes, the price of NZDJPY will go towards 92.19.
NZDJPY D1
Head and Shoulders
The technical pattern called Head and Shoulders has appeared on the chart of NZDJPY D1. There are weighty reasons to suggest that the price will surpass the Neckline 92.46/92.59 after the right shoulder has been formed. So, the trend is set to change with the price heading for 92.19.
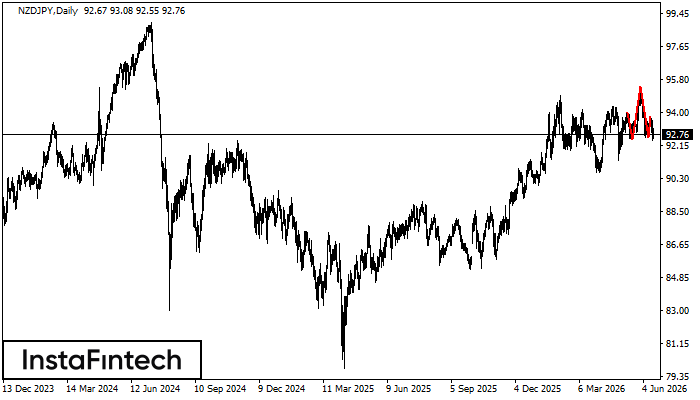
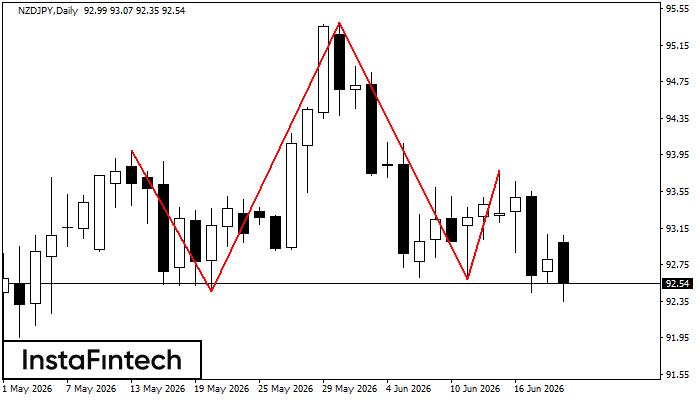
NZDJPY D1
Head and Shoulders
According to the chart of D1, NZDJPY formed the Head and Shoulders pattern. The Head’s top is set at 95.40 while the median line of the Neck is found at 92.46/92.59. The formation of the Head and Shoulders pattern evidently signals a reversal of the upward trend. In other words, in case the scenario comes true, the price of NZDJPY will go towards 92.19.
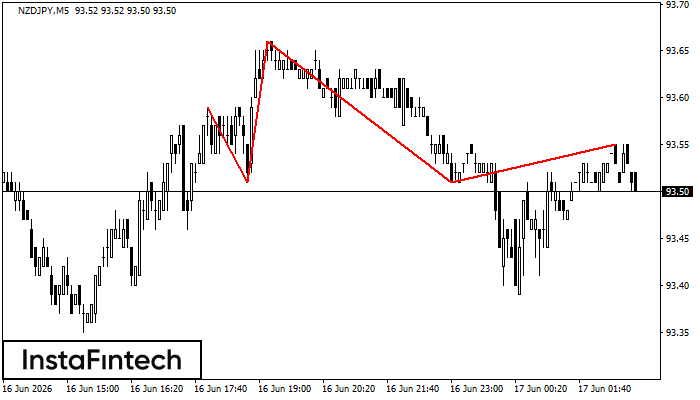
NZDJPY M5
Head and Shoulders
According to the chart of M5, NZDJPY formed the Head and Shoulders pattern. The Head’s top is set at 93.66 while the median line of the Neck is found at 93.51/93.51. The formation of the Head and Shoulders pattern evidently signals a reversal of the upward trend. In other words, in case the scenario comes true, the price of NZDJPY will go towards 93.36.