 Română
 Русский
 English
 Bahasa Indonesia
 Bahasa Malay
 ไทย
ไทย Español
 Deutsch
 Български
 Français
 Tiếng Việt
 中文
中文 বাংলা
বাংলা हिन्दी
 Čeština
 Українська
FX.co ★ Patterns #Bitcoin | Bitcoin cryptocurrency Rate in the Forex market

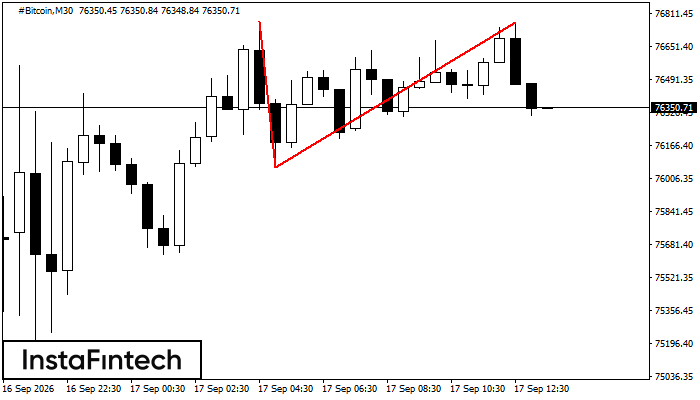
#Bitcoin M30
Double Top
The Double Top reversal pattern has formed on the #Bitcoin M30 chart. Its upper boundary is at 76774.85, its lower boundary is at 76060.22, and its width is 71087 points. A short position may be considered below the lower boundary at 76060.22, with a potential target at 76059.92.
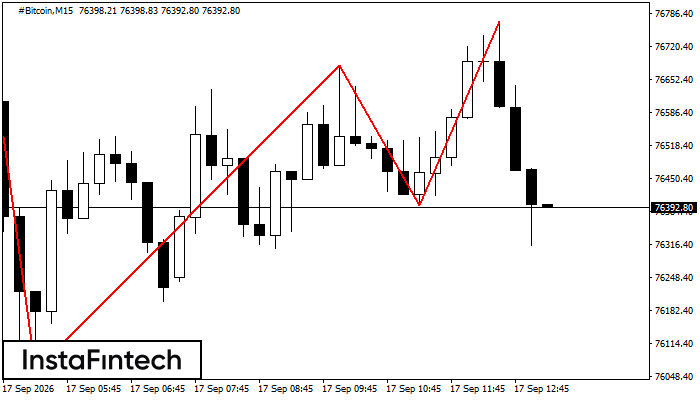
#Bitcoin M15
Triple Top
The Triple Top reversal pattern has formed on the #Bitcoin M15 chart. Its upper boundary is at 76774.85/76771.09, its lower boundary is at 76060.22/76395.41, and its current width is 28546 points. If the confirmation support at 76060.22 is broken, that width can be used to project the downward move.
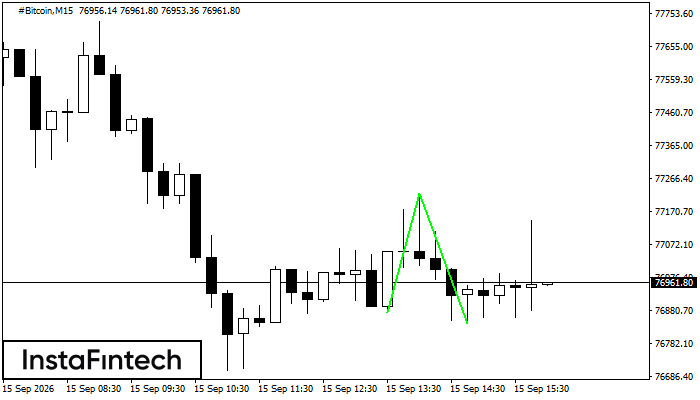
#Bitcoin M15
Double Bottom
The Double Bottom pattern has formed on the #Bitcoin M15 chart. Its support is at 76872.42, its resistance is at 77224.74, and its width is 35232 points. A break above resistance may confirm a trend reversal, with the first target projected 38270 points away.
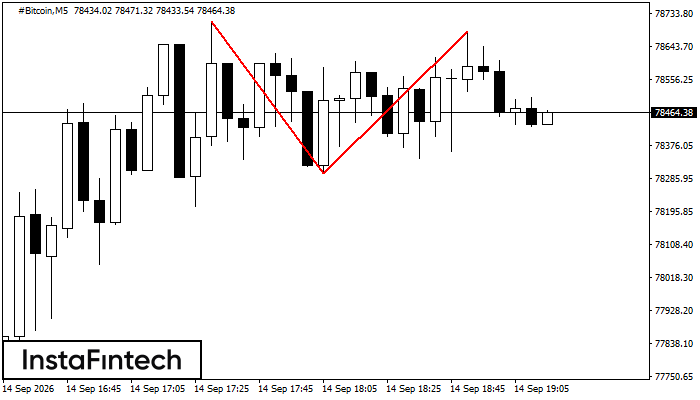
#Bitcoin M5
Double Top
The Double Top reversal pattern has formed on the #Bitcoin M5 chart. Its upper boundary is at 78712.56, its lower boundary is at 78301.31, and its width is 38478 points. A short position may be considered below the lower boundary at 78301.31, with a potential target at 78301.16.
#Bitcoin M15
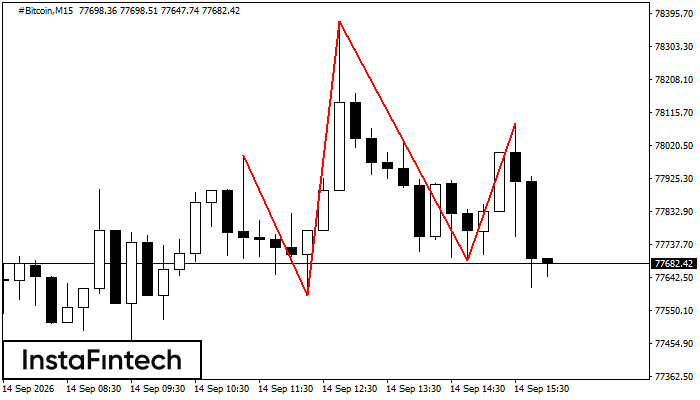
Head and Shoulders
The Head and Shoulders pattern has formed on the #Bitcoin M15 chart. The head high is at 78374.15, while the neckline passes through 77593.57/77692.21. The Head and Shoulders signals a potential reversal of the uptrend. A break below the lower neckline anchor may confirm the bearish reversal.
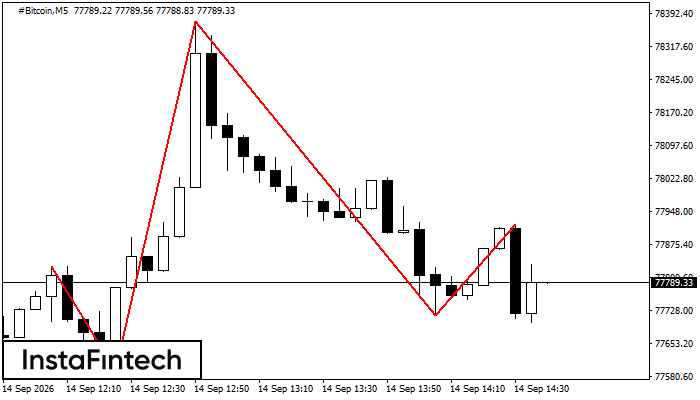
#Bitcoin M5
Head and Shoulders
The Head and Shoulders pattern has formed on the #Bitcoin M5 chart. After the right shoulder forms, a break below the lower of the neckline anchors at 77593.57/77716.49 may confirm the bearish reversal.
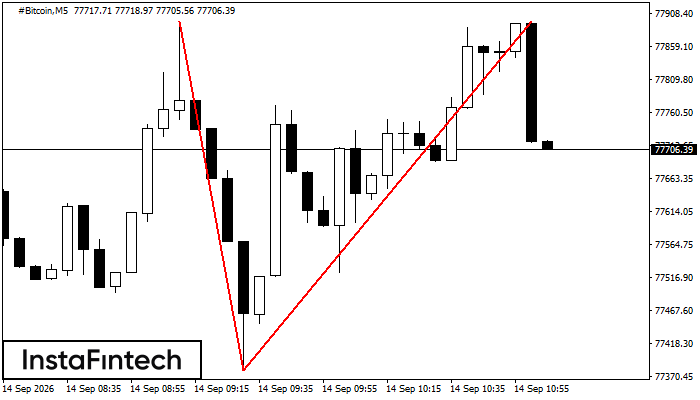
#Bitcoin M5
Double Top
The Double Top reversal pattern has formed on the #Bitcoin M5 chart. Its upper boundary is at 77896.00, its lower boundary is at 77379.07, and its width is 51684 points. A short position may be considered below the lower boundary at 77379.07, with a potential target at 77378.92.
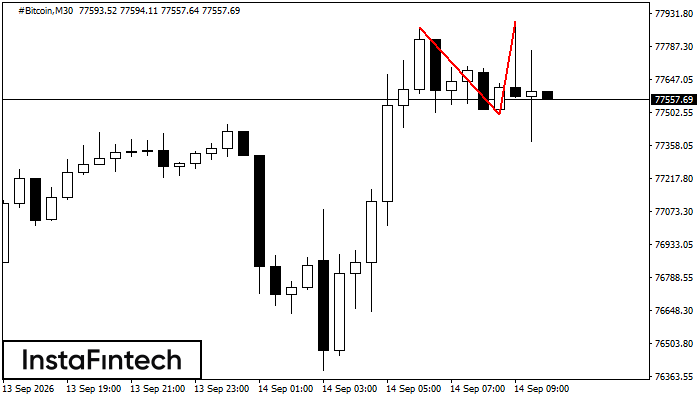
#Bitcoin M30
Double Top
The Double Top reversal pattern has formed on the #Bitcoin M30 chart. Its upper boundary is at 77869.61, its lower boundary is at 77493.63, and its width is 40237 points. A short position may be considered below the lower boundary at 77493.63, with a potential target at 77493.33.
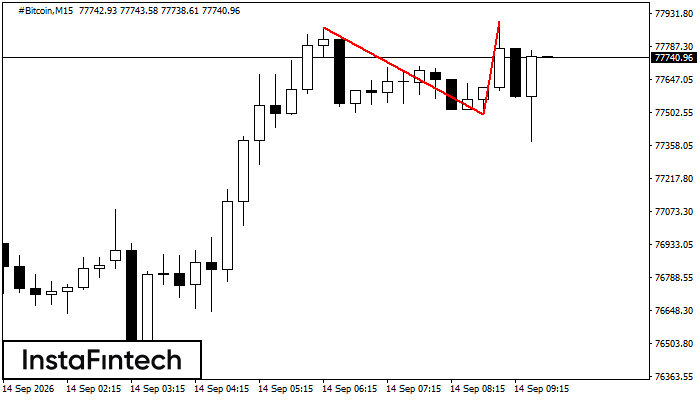
#Bitcoin M15
Double Top
The Double Top reversal pattern has formed on the #Bitcoin M15 chart. Its upper boundary is at 77869.61, its lower boundary is at 77493.63, and its width is 40237 points. A short position may be considered below the lower boundary at 77493.63, with a potential target at 77493.41.
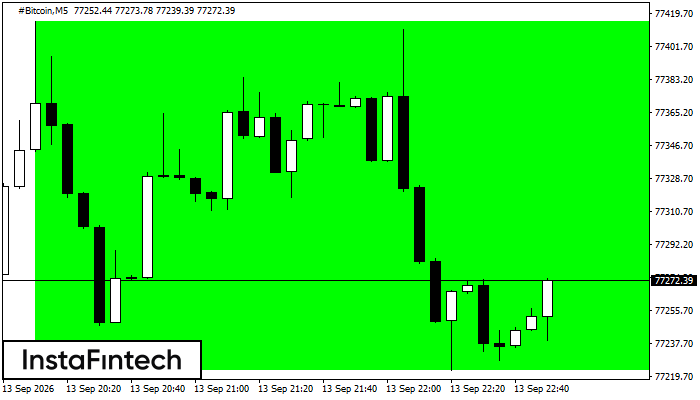
#Bitcoin M5
Bullish Rectangle
The Bullish Rectangle has formed on the #Bitcoin M5 chart. This is a trend continuation pattern bounded by the lower boundary at 77223.07–77223.07 and the upper boundary at 77415.30–77415.30. A breakout above the upper boundary is likely to signal a continuation of the uptrend.