 Română
  Русский
 English
 Bahasa Indonesia
 Bahasa Malay
 ไทย
ไทย Español
 Deutsch
 Български
 Français
 Tiếng Việt
 中文
中文 বাংলা
বাংলা हिन्दी
 Čeština
 Українська
FX.co ★ Patterns #EBAY | eBay Inc. Stock Price

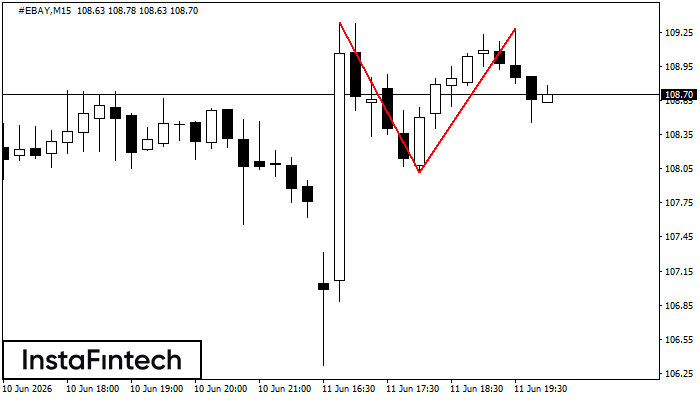
#EBAY M15
Double Top
The Double Top reversal pattern has been formed on #EBAY M15. Characteristics: the upper boundary 109.34; the lower boundary 108.02; the width of the pattern is 126 points. Sell trades are better to be opened below the lower boundary 108.02 with a possible movements towards the 107.79 level.
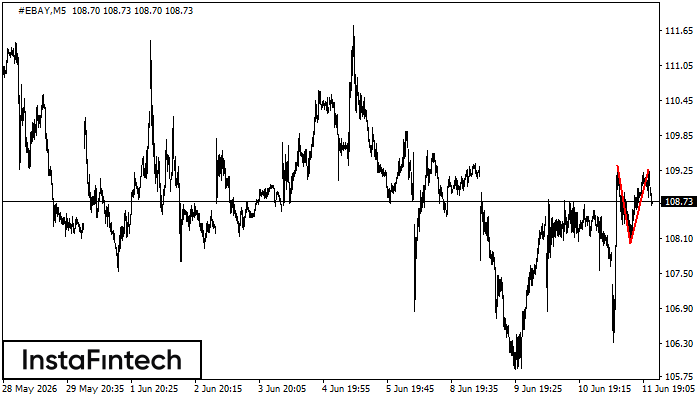
#EBAY M5
Double Top
On the chart of #EBAY M5 the Double Top reversal pattern has been formed. Characteristics: the upper boundary 109.28; the lower boundary 108.02; the width of the pattern 126 points. The signal: a break of the lower boundary will cause continuation of the downward trend targeting the 107.87 level.
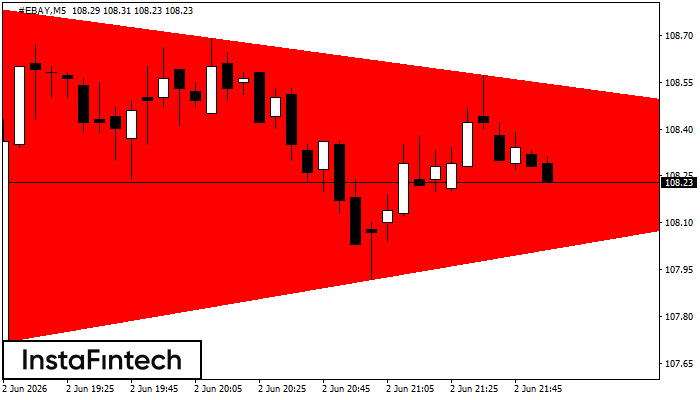
#EBAY M5
Bearish Symmetrical Triangle
According to the chart of M5, #EBAY formed the Bearish Symmetrical Triangle pattern. This pattern signals a further downward trend in case the lower border 107.71 is breached. Here, a hypothetical profit will equal the width of the available pattern that is -108 pips.
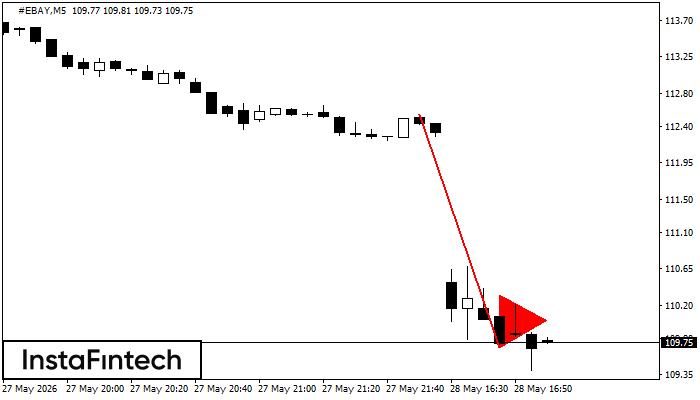
#EBAY M5
Bearish pennant
The Bearish pennant pattern has formed on the #EBAY M5 chart. This pattern type is characterized by a slight slowdown after which the price will move in the direction of the original trend. In case the price fixes below the pattern’s low of 109.69, a trader will be able to successfully enter the sell position.
#EBAY M30
Double Top
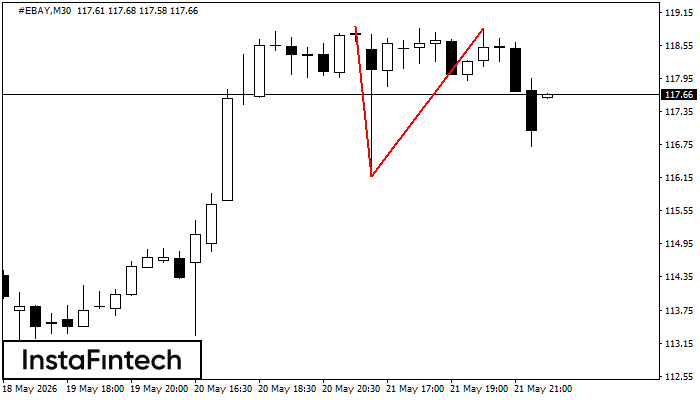
On the chart of #EBAY M30 the Double Top reversal pattern has been formed. Characteristics: the upper boundary 118.85; the lower boundary 116.17; the width of the pattern 268 points. The signal: a break of the lower boundary will cause continuation of the downward trend targeting the 115.87 level.
#EBAY M30
Double Top
The Double Top reversal pattern has been formed on #EBAY M30. Characteristics: the upper boundary 118.89; the lower boundary 116.17; the width of the pattern is 268 points. Sell trades are better to be opened below the lower boundary 116.17 with a possible movements towards the 115.87 level.
#EBAY M15
Triple Top
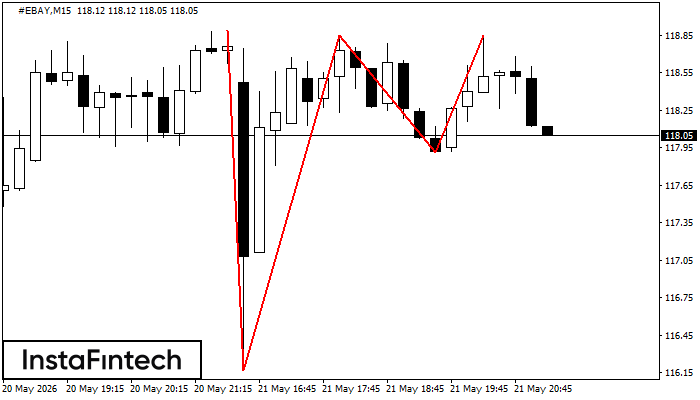
On the chart of the #EBAY M15 trading instrument, the Triple Top pattern that signals a trend change has formed. It is possible that after formation of the third peak, the price will try to break through the resistance level 116.17, where we advise to open a trading position for sale. Take profit is the projection of the pattern’s width, which is 272 points.
#EBAY M15
Double Top
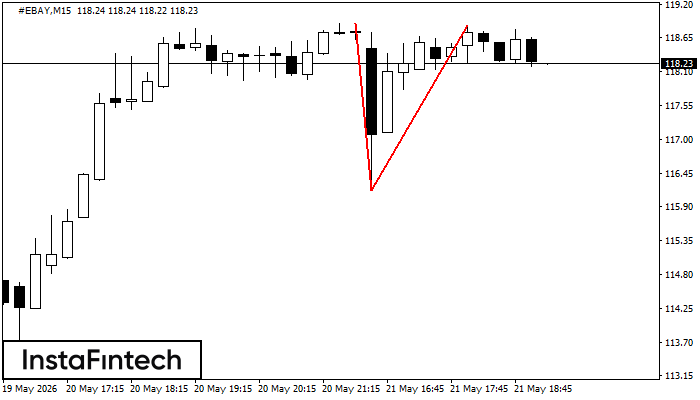
The Double Top reversal pattern has been formed on #EBAY M15. Characteristics: the upper boundary 118.89; the lower boundary 116.17; the width of the pattern is 268 points. Sell trades are better to be opened below the lower boundary 116.17 with a possible movements towards the 115.94 level.
#EBAY M5
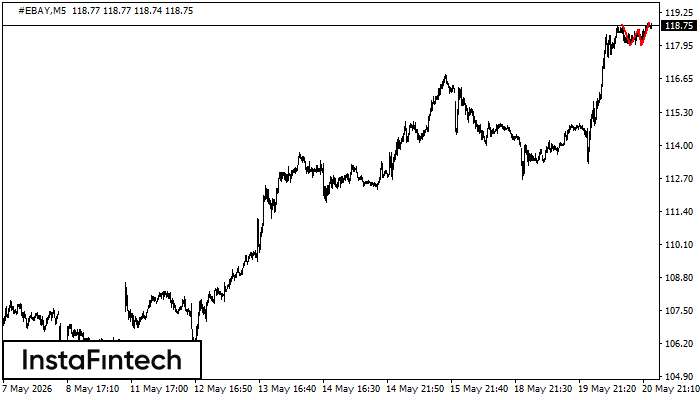
Triple Top
The Triple Top pattern has formed on the chart of the #EBAY M5 trading instrument. It is a reversal pattern featuring the following characteristics: resistance level -11, support level -12, and pattern’s width 54. Forecast If the price breaks through the support level 118.13, it is likely to move further down to 118.70.
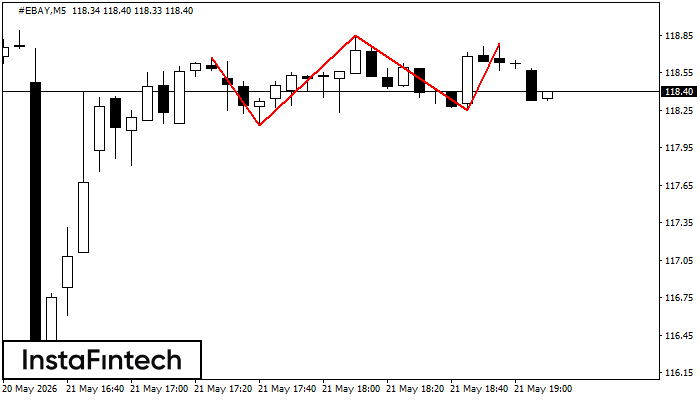
#EBAY M5
Triple Top
The Triple Top pattern has formed on the chart of the #EBAY M5 trading instrument. It is a reversal pattern featuring the following characteristics: resistance level -8, support level -1, and pattern’s width 84. Forecast If the price breaks through the support level 117.96, it is likely to move further down to 118.44.