 Română
 Русский
 English
 Bahasa Indonesia
 Bahasa Malay
 ไทย
ไทย Español
 Deutsch
 Български
 Français
 Tiếng Việt
 中文
中文 বাংলা
বাংলা हिन्दी
 Čeština
 Українська
FX.co ★ Patterns GBPJPY | British Pound (GBP) to Japanese Yen (JPY) Rate in the Forex market

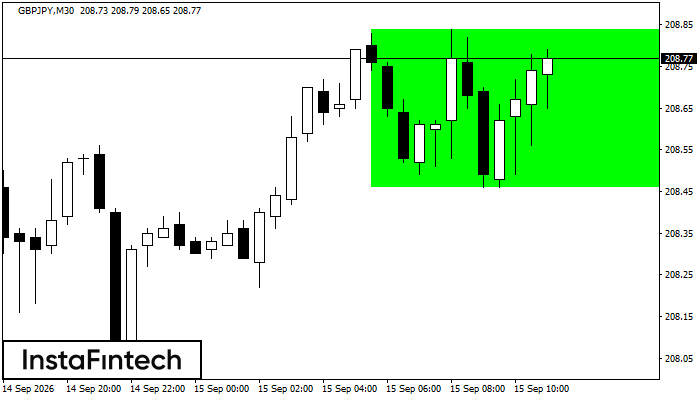
GBPJPY M30
Bullish Rectangle
The Bullish Rectangle has formed on the GBPJPY M30 chart. This pattern indicates a likely continuation of the trend. Its resistance is at 208.84 and its support is at 208.46. A breakout above the resistance zone at 208.84–208.84 is likely to signal a continuation of the bullish trend.
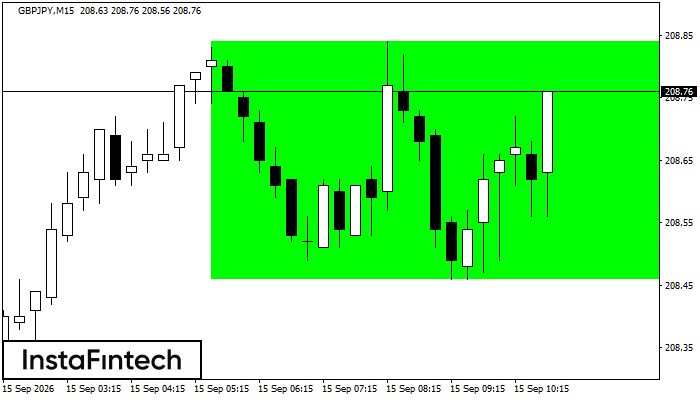
GBPJPY M15
Bullish Rectangle
The Bullish Rectangle has formed on the GBPJPY M15 chart. This pattern indicates a likely continuation of the trend. Its resistance is at 208.84 and its support is at 208.46. A breakout above the resistance zone at 208.84–208.84 is likely to signal a continuation of the bullish trend.
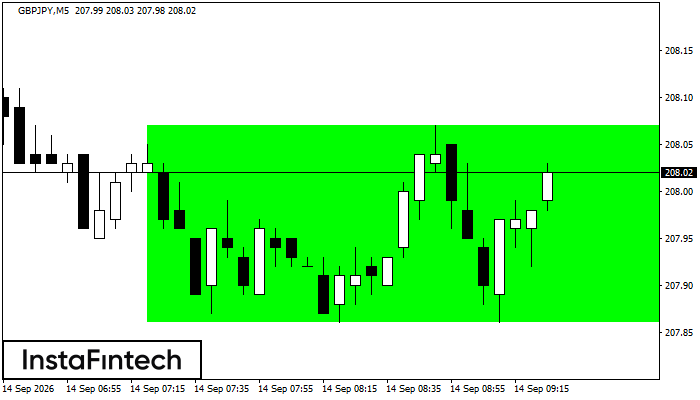
GBPJPY M5
Bullish Rectangle
The Bullish Rectangle has formed on the GBPJPY M5 chart. This pattern indicates a likely continuation of the trend. Its resistance is at 208.07 and its support is at 207.86. A breakout above the resistance zone at 208.07–208.07 is likely to signal a continuation of the bullish trend.
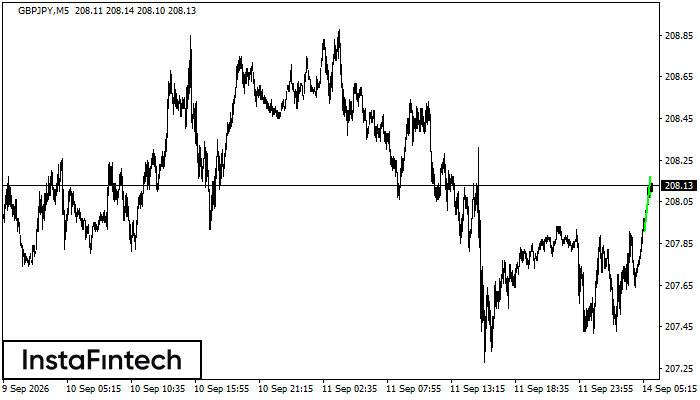
GBPJPY M5
Bullish Pennant
The Bullish Pennant pattern has formed on the GBPJPY M5 chart. This is a continuation pattern. If the price closes above the pennant high at 208.17, the uptrend is likely to continue.
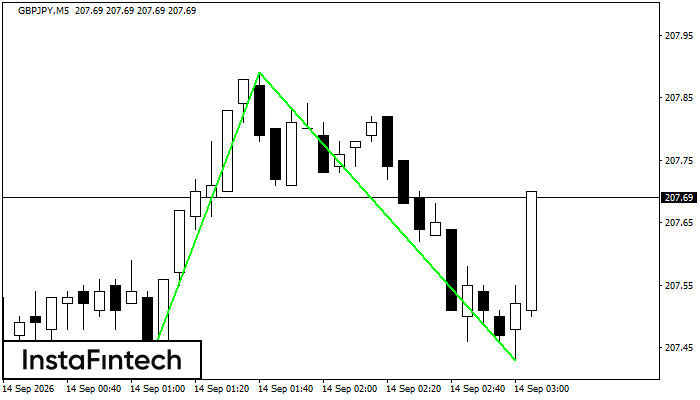
GBPJPY M5
Double Bottom
The Double Bottom pattern has formed on the GBPJPY M5 chart. Its support is at 207.42, its resistance is at 207.89, and its width is 47 points. A break above resistance may confirm a trend reversal, with the first target projected 46 points away.
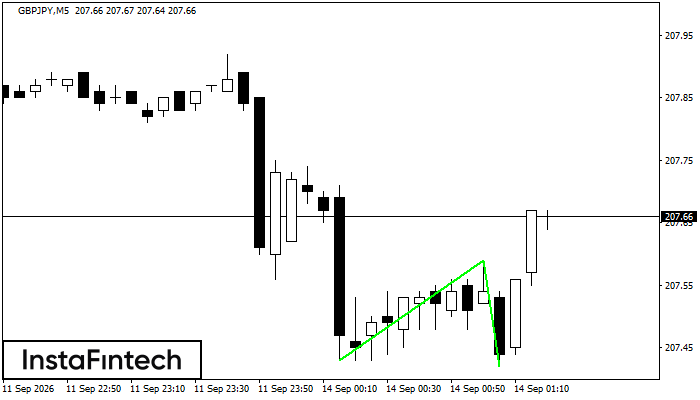
GBPJPY M5
Double Bottom
The Double Bottom pattern has formed on the GBPJPY M5 chart. Its support is at 207.43, its resistance is at 207.59, and its width is 16 points. A break above resistance may confirm a trend reversal, with the first target projected 17 points away.
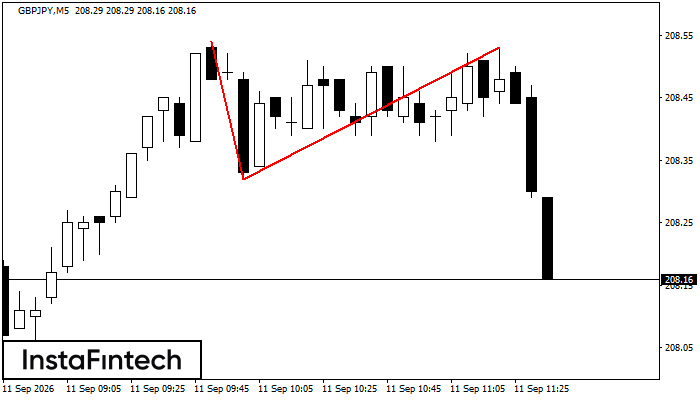
GBPJPY M5
Double Top
The Double Top reversal pattern has formed on the GBPJPY M5 chart. Its upper boundary is at 208.53, its lower boundary is at 208.32, and its width is 21 points. A break below the lower boundary is likely to confirm further downward movement toward 208.17.
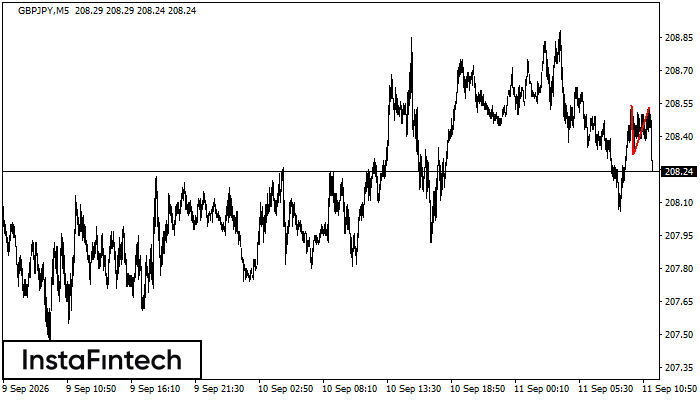
GBPJPY M5
Double Top
The Double Top reversal pattern has formed on the GBPJPY M5 chart. Its upper boundary is at 208.54, its lower boundary is at 208.32, and its width is 21 points. A short position may be considered below the lower boundary at 208.32, with a potential target at 208.17.
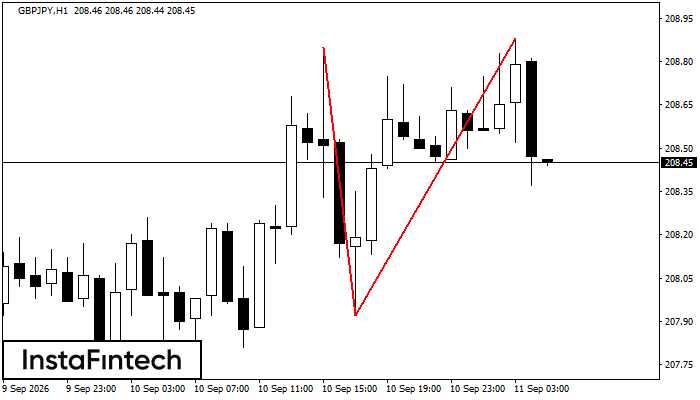
GBPJPY H1
Double Top
The Double Top pattern has formed on the GBPJPY H1 chart and signals a potential reversal from an uptrend to a downtrend. A break below the pattern base at 207.92 is likely to confirm further downward movement.
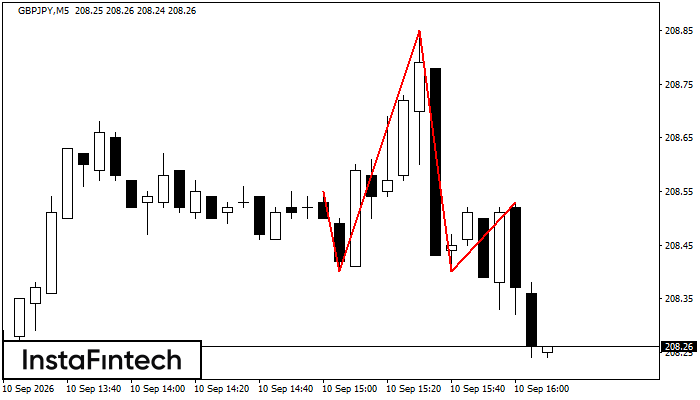
GBPJPY M5
Head and Shoulders
The Head and Shoulders pattern has formed on the GBPJPY M5 chart. The head high is at 208.85, while the neckline passes through 208.40/208.40. The pattern may reverse the current uptrend. A break below the lower neckline anchor may confirm the bearish reversal.