 Română
  Русский
 English
 Bahasa Indonesia
 Bahasa Malay
 ไทย
ไทย Español
 Deutsch
 Български
 Français
 Tiếng Việt
 中文
中文 বাংলা
বাংলা हिन्दी
 Čeština
 Українська
FX.co ★ Patterns GBPUSD | British Pound (GBP) to US Dollar (USD) Rate in the Forex market


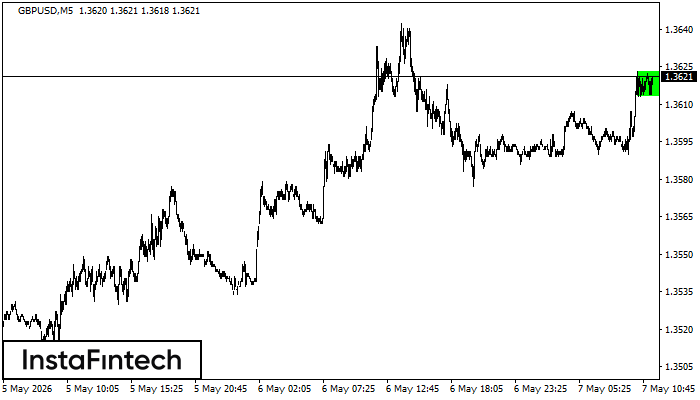
GBPUSD M5
Bullish Symmetrical Triangle
According to the chart of M5, GBPUSD formed the Bullish Symmetrical Triangle pattern. Description: This is the pattern of a trend continuation. 1.3623 and 1.3613 are the coordinates of the upper and lower borders respectively. The pattern width is measured on the chart at 10 pips. Outlook: If the upper border 1.3623 is broken, the price is likely to continue its move by 1.3633.
GBPUSD M5
Bullish Rectangle
According to the chart of M5, GBPUSD formed the Bullish Rectangle. The pattern indicates a trend continuation. The upper border is 1.3623, the lower border is 1.3613. The signal means that a long position should be opened above the upper border 1.3623 of the Bullish Rectangle.
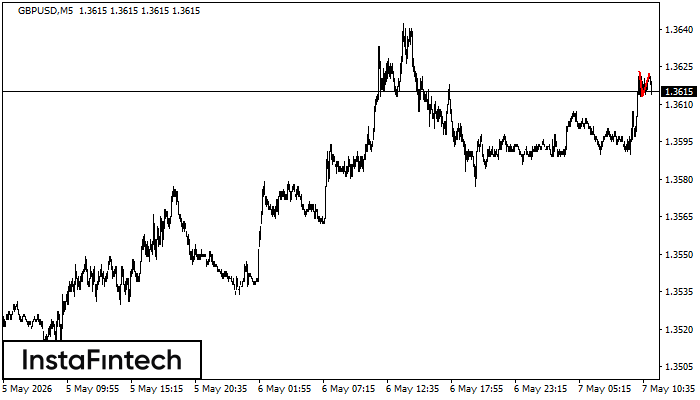
GBPUSD M5
Double Top
On the chart of GBPUSD M5 the Double Top reversal pattern has been formed. Characteristics: the upper boundary 1.3622; the lower boundary 1.3613; the width of the pattern 9 points. The signal: a break of the lower boundary will cause continuation of the downward trend targeting the 1.3598 level.
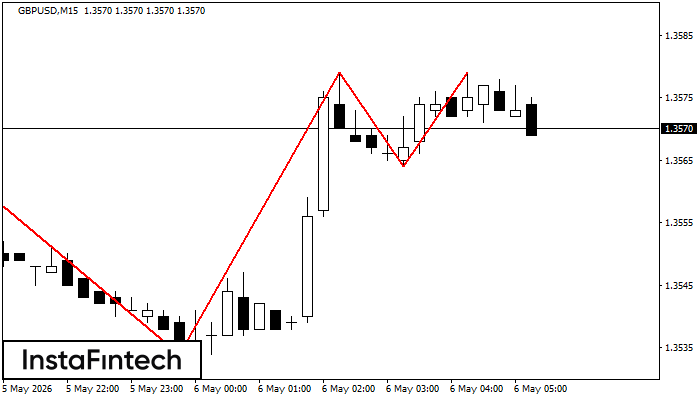
GBPUSD M15
Triple Top
The Triple Top pattern has formed on the chart of the GBPUSD M15. Features of the pattern: borders have an ascending angle; the lower line of the pattern has the coordinates 1.3534/1.3564 with the upper limit 1.3577/1.3579; the projection of the width is 43 points. The formation of the Triple Top figure most likely indicates a change in the trend from upward to downward. This means that in the event of a breakdown of the support level of 1.3534, the price is most likely to continue the downward movement.
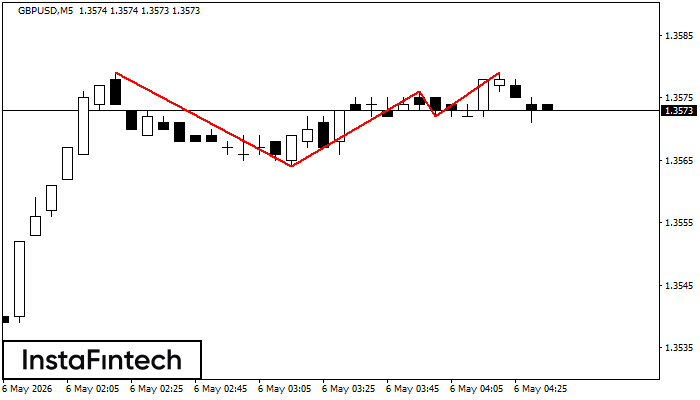
GBPUSD M5
Triple Top
The Triple Top pattern has formed on the chart of the GBPUSD M5 trading instrument. It is a reversal pattern featuring the following characteristics: resistance level 0, support level -8, and pattern’s width 15. Forecast If the price breaks through the support level 1.3564, it is likely to move further down to 1.3561.
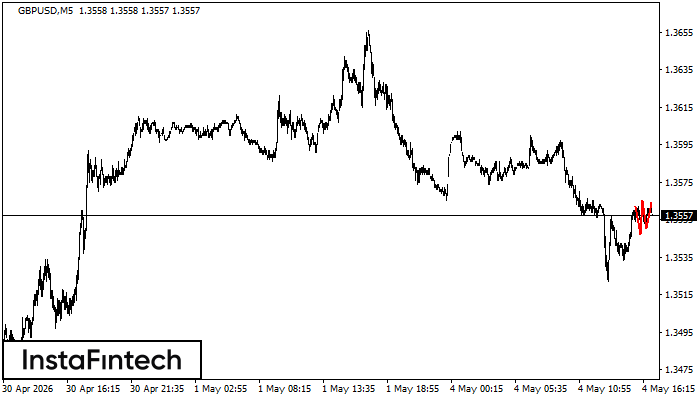
GBPUSD M5
Triple Bottom
The Triple Bottom pattern has formed on the chart of the GBPUSD M5 trading instrument. The pattern signals a change in the trend from downwards to upwards in the case of breakdown of 1.3554/1.3552.
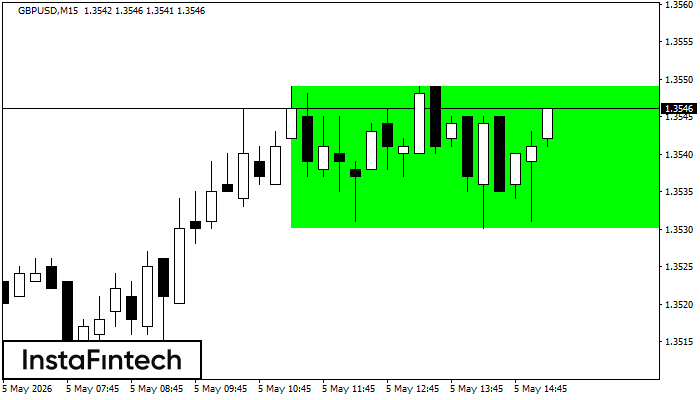
GBPUSD M15
Bullish Rectangle
According to the chart of M15, GBPUSD formed the Bullish Rectangle. The pattern indicates a trend continuation. The upper border is 1.3549, the lower border is 1.3530. The signal means that a long position should be opened above the upper border 1.3549 of the Bullish Rectangle.
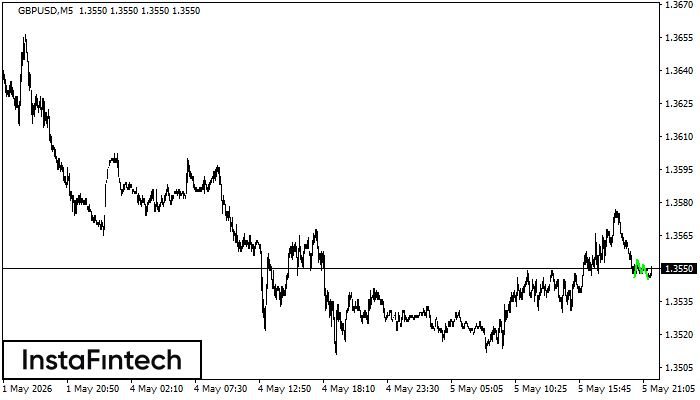
GBPUSD M5
Triple Top
The Triple Top pattern has formed on the chart of the GBPUSD M5 trading instrument. It is a reversal pattern featuring the following characteristics: resistance level -2, support level -3, and pattern’s width 15. Forecast If the price breaks through the support level 1.3547, it is likely to move further down to 1.3550.
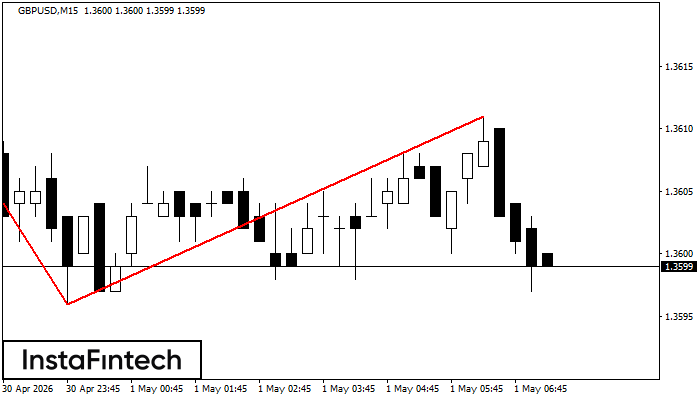
GBPUSD M15
Double Top
The Double Top pattern has been formed on GBPUSD M15. It signals that the trend has been changed from upwards to downwards. Probably, if the base of the pattern 1.3596 is broken, the downward movement will continue.
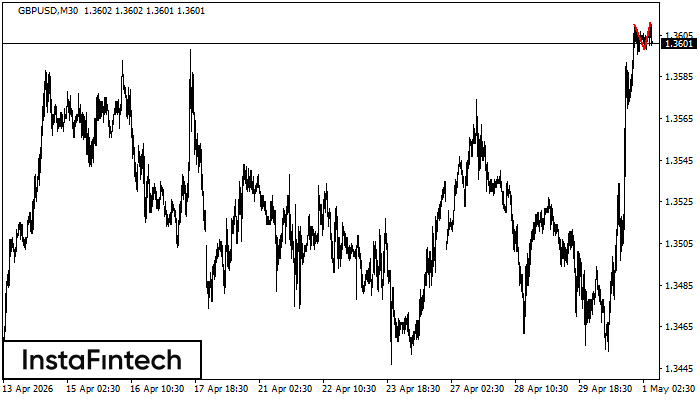
GBPUSD M30
Double Top
The Double Top reversal pattern has been formed on GBPUSD M30. Characteristics: the upper boundary 1.3610; the lower boundary 1.3598; the width of the pattern is 13 points. Sell trades are better to be opened below the lower boundary 1.3598 with a possible movements towards the 1.3568 level.