 Română

 Русский
 English
 Bahasa Indonesia
 Bahasa Malay
 ไทย
 Español
 Deutsch
 Български
 Français
 Tiếng Việt
 中文
 বাংলা
 हिन्दी
 Čeština
 Українська

FX.co ★ Patterns GOLD | Gold Rate in the Forex market

GOLD M5
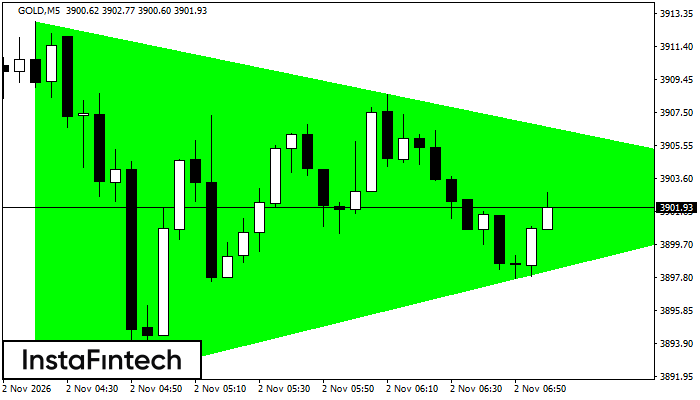
Bullish Symmetrical Triangle
The Bullish Symmetrical Triangle pattern has formed on the GOLD M5 chart, signaling a likely continuation of the trend. Its upper boundary passes through 3912.85/3902.81, while its lower boundary passes through 3890.72/3902.81. The pattern width is 2213 points. When the Bullish Symmetrical Triangle forms during an uptrend, it indicates that the prevailing trend may continue. A breakout above 3902.81 could send the price toward 3902.96.
GOLD M5
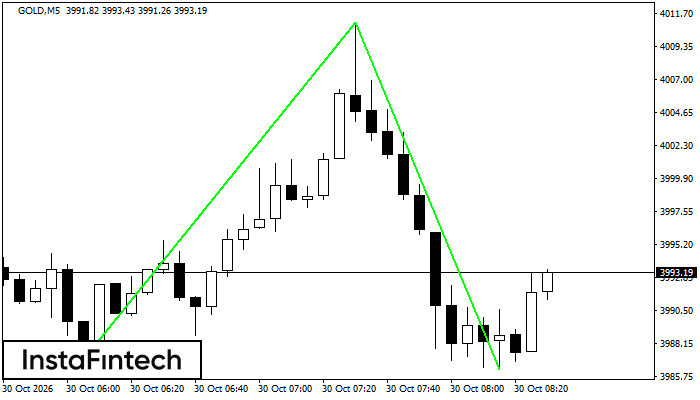
Double Bottom
The Double Bottom pattern has formed on the GOLD M5 chart and signals a potential reversal from a downtrend to an uptrend. A long position may be considered after the price breaks above the upper boundary at 4011.10. The projected move is based on the pattern width of 2411 points.
GOLD M5
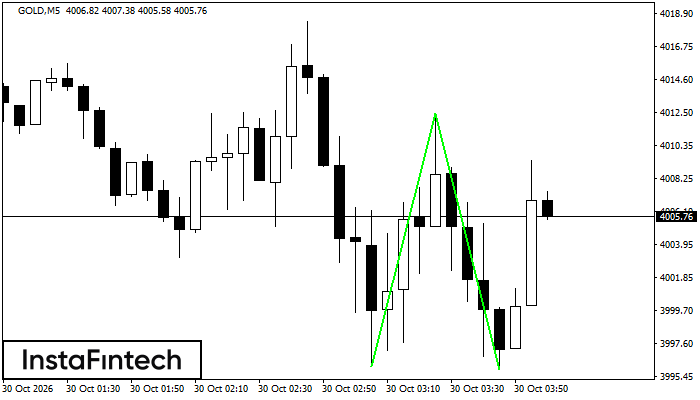
Double Bottom
The Double Bottom pattern has formed on the GOLD M5 chart. Its support is at 3996.08, its resistance is at 4012.44, and its width is 1636 points. A break above resistance may confirm a trend reversal, with the first target projected 1654 points away.
GOLD M5
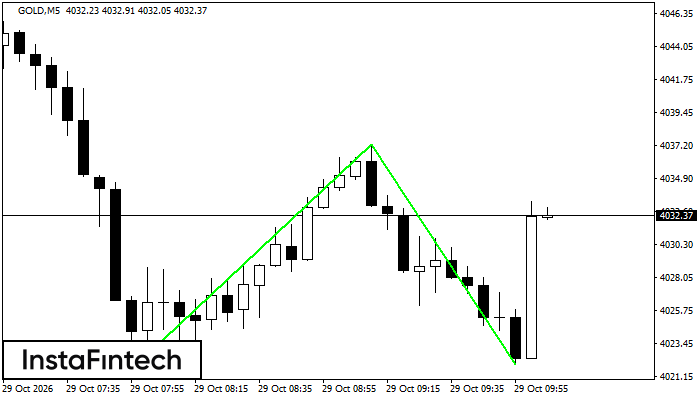
Double Bottom
The Double Bottom pattern has formed on the GOLD M5 chart. Its support is at 4021.65, its resistance is at 4037.27, and its width is 1562 points. A break above resistance may confirm a trend reversal, with the first target projected 1523 points away.
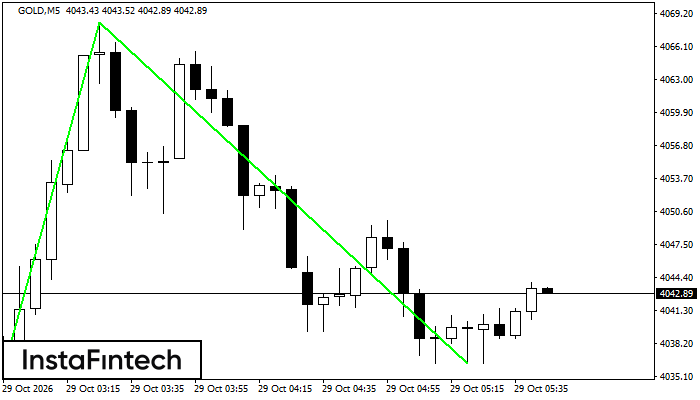
GOLD M5
Double Bottom
The Double Bottom pattern has formed on the GOLD M5 chart and signals a potential reversal from a downtrend to an uptrend. A long position may be considered after the price breaks above the upper boundary at 4068.40. The projected move is based on the pattern width of 3260 points.
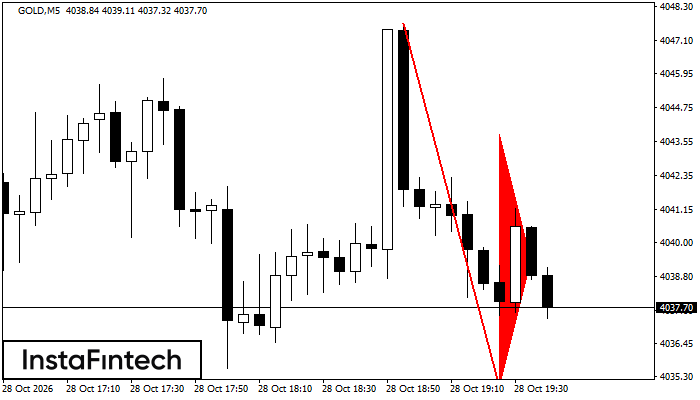
GOLD M5
Bearish Pennant
The Bearish Pennant pattern has formed on the GOLD M5 chart and signals a potential continuation of the existing trend. The pattern low is at 4034.90, and the projected flagpole height is 1280 points. If the price breaks below the pattern low at 4034.90, the downtrend is expected to continue toward 4034.75.
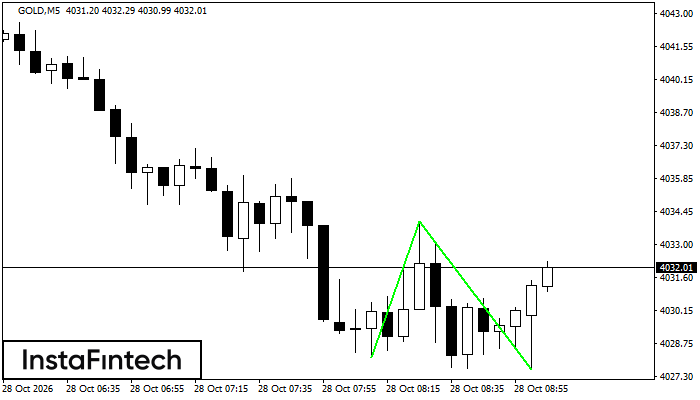
GOLD M5
Double Bottom
The Double Bottom pattern has formed on the GOLD M5 chart. Its support is at 4028.15, its resistance is at 4033.99, and its width is 584 points. A break above resistance may confirm a trend reversal, with the first target projected 639 points away.
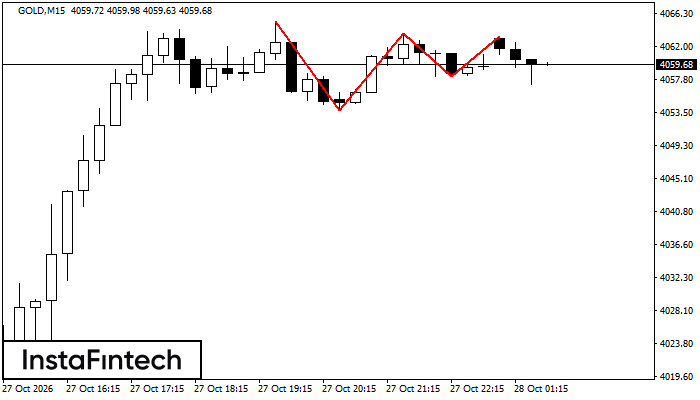
GOLD M15
Triple Top
The Triple Top pattern has formed on the chart of GOLD M15 and signals a possible trend reversal. After the third peak forms, a break below the confirmation support at 4053.87 may confirm the bearish scenario. The projected peak-to-trough width is 558 points.
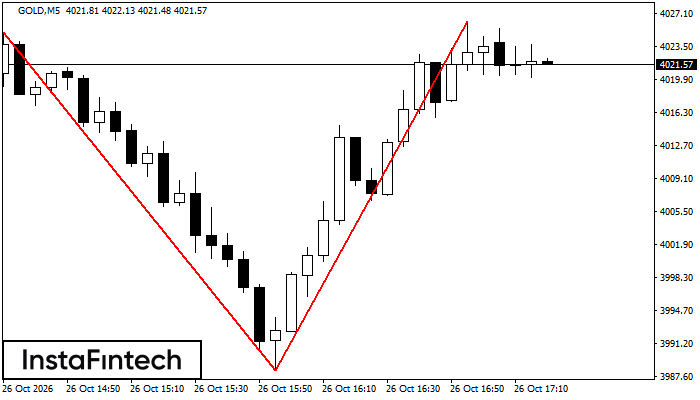
GOLD M5
Double Top
The Double Top reversal pattern has formed on the GOLD M5 chart. Its upper boundary is at 4026.18, its lower boundary is at 3988.26, and its width is 3792 points. A break below the lower boundary is likely to confirm further downward movement toward 3988.11.
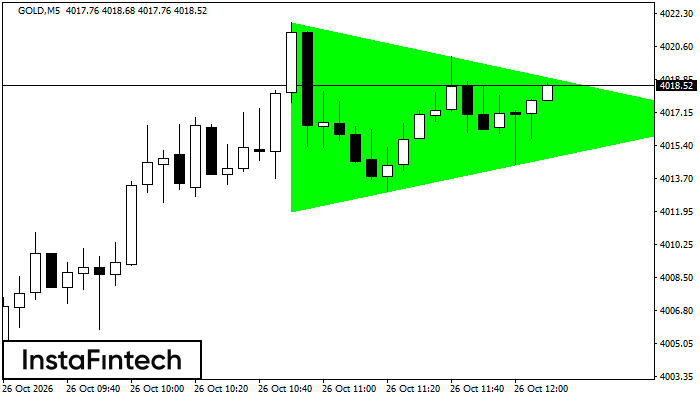
GOLD M5
Bullish Symmetrical Triangle
The Bullish Symmetrical Triangle pattern has formed on the GOLD M5 chart. Its lower boundary passes through 4011.97/4016.83, while its upper boundary passes through 4021.85/4016.83. The Bullish Symmetrical Triangle is a continuation pattern and therefore supports a further rise. If confirmed, GOLD is expected to break the upper boundary and move toward 4016.98.