 Română

 Русский
 English
 Bahasa Indonesia
 Bahasa Malay
 ไทย
 Español
 Deutsch
 Български
 Français
 Tiếng Việt
 中文
 বাংলা
 हिन्दी
 Čeština
 Українська

FX.co ★ Patterns #KO | The Coca-Cola Company Stock Price

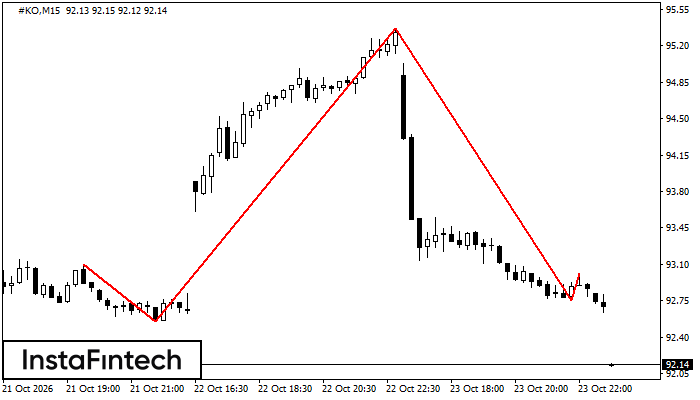
#KO M15
Head and Shoulders
The Head and Shoulders pattern has formed on the #KO M15 chart. The head high is at 95.36, while the neckline passes through 92.55/92.75. The Head and Shoulders signals a potential reversal of the uptrend. A break below the lower neckline anchor may confirm the bearish reversal.
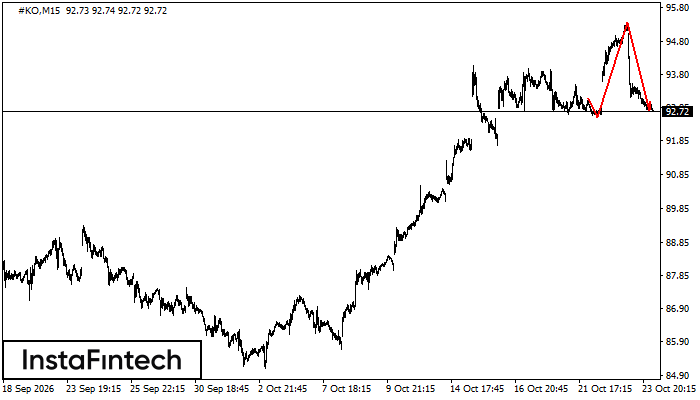
#KO M15
Head and Shoulders
The Head and Shoulders pattern has formed on the #KO M15 chart. The head high is at 95.36, while the neckline passes through 92.55/92.75. The pattern may reverse the current uptrend. A break below the lower neckline anchor may confirm the bearish reversal.
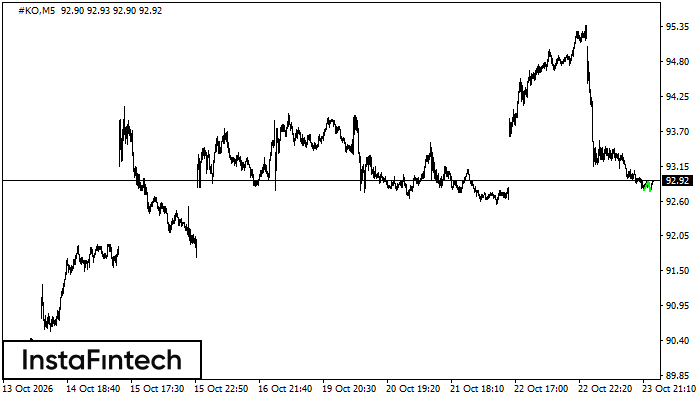
#KO M5
Double Bottom
The Double Bottom pattern has formed on the #KO M5 chart and signals a potential reversal from a downtrend to an uptrend. A long position may be considered after the price breaks above the upper boundary at 92.91. The projected move is based on the pattern width of 14 points.
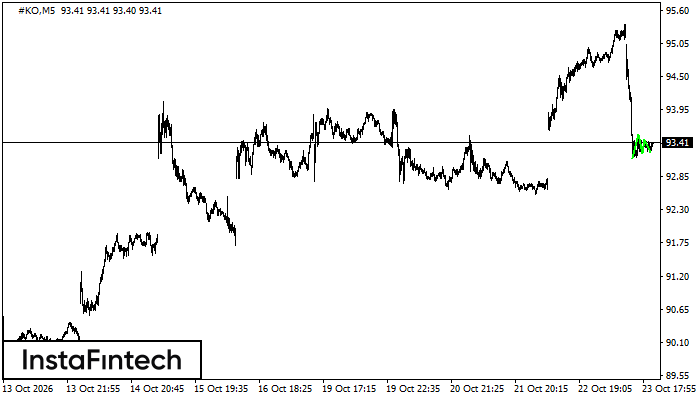
#KO M5
Triple Bottom
The Triple Bottom pattern has formed on the chart of #KO M5. The lower boundary is at 93.24, while the upper boundary is at 93.55/93.46. The projected width is 33 points. The formation of the Triple Bottom pattern most likely indicates a change from a downward to an upward trend. If the confirmation resistance at 93.55 is broken, the price is likely to continue upward.
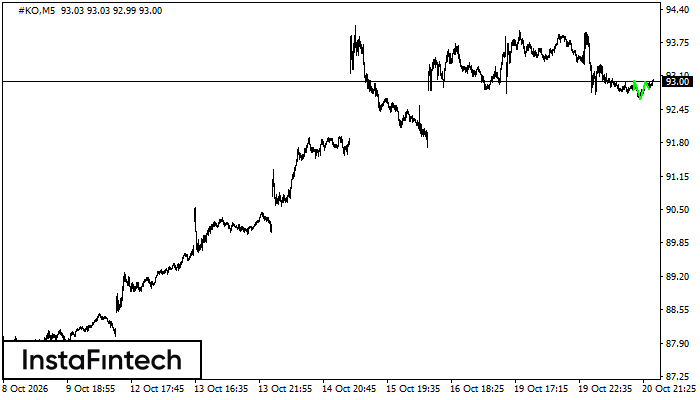
#KO M5
Inverse Head and Shoulders
The Inverse Head and Shoulders pattern has formed on the #KO M5 chart. A break above the higher of the neckline anchors at 93.01/93.00 may confirm the bullish reversal.
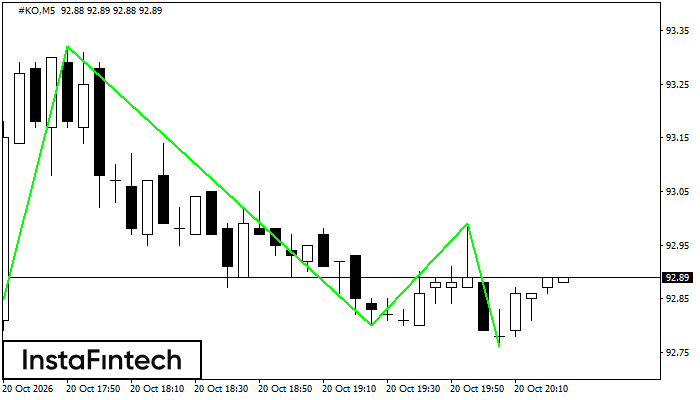
#KO M5
Triple Bottom
The Triple Bottom pattern has formed on the #KO M5 chart. It has the following characteristics: resistance at 92.99; support at 92.76; pattern width of 23 points. If the confirmation resistance at 93.32 is broken, the price is likely to continue upward by at least 52 points.
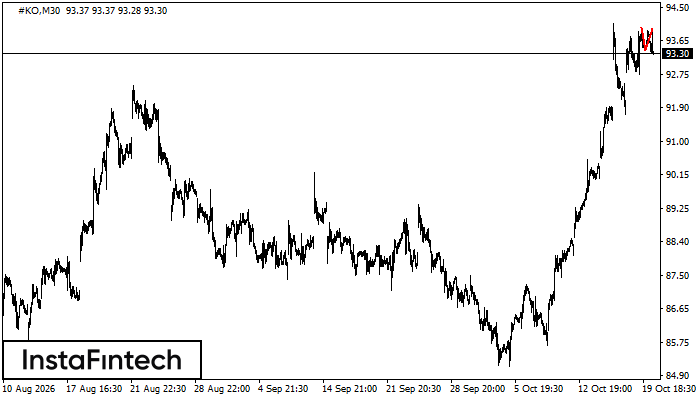
#KO M30
Double Top
The Double Top reversal pattern has formed on the #KO M30 chart. Its upper boundary is at 93.95, its lower boundary is at 93.39, and its width is 56 points. A break below the lower boundary is likely to confirm further downward movement toward 93.09.
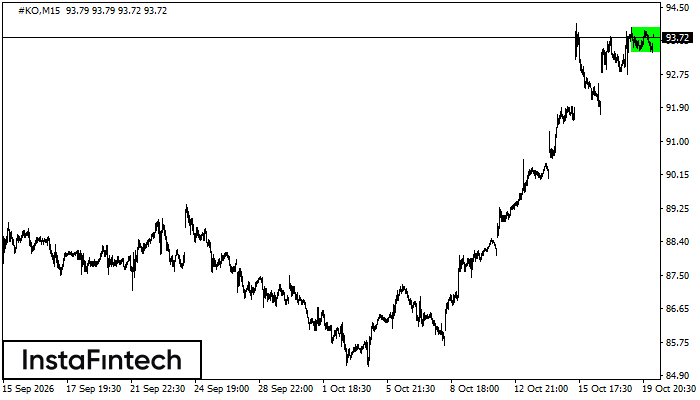
#KO M15
Bullish Rectangle
The Bullish Rectangle has formed on the #KO M15 chart. This pattern indicates a likely continuation of the trend. Its resistance is at 93.98 and its support is at 93.34. A breakout above the resistance zone at 93.98–93.98 is likely to signal a continuation of the bullish trend.
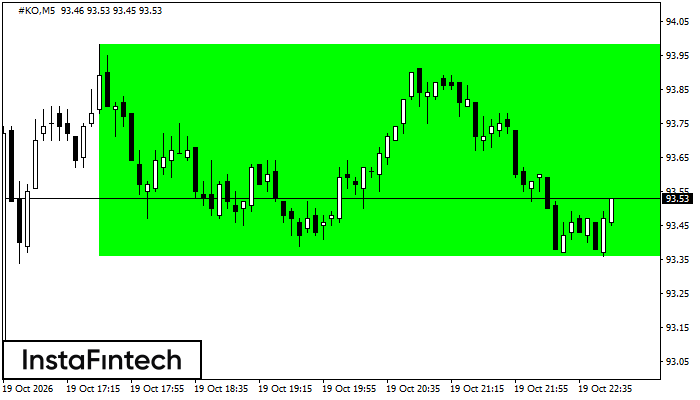
#KO M5
Bullish Rectangle
The Bullish Rectangle has formed on the #KO M5 chart. This pattern indicates a likely continuation of the trend. Its resistance is at 93.98 and its support is at 93.36. A breakout above the resistance zone at 93.98–93.98 is likely to signal a continuation of the bullish trend.
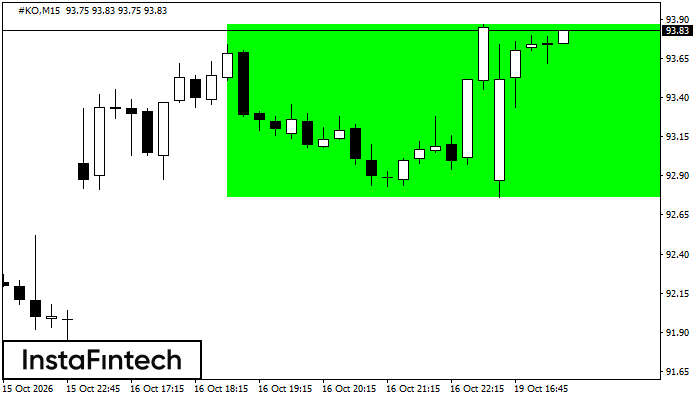
#KO M15
Bullish Rectangle
The Bullish Rectangle has formed on the #KO M15 chart. This pattern indicates a likely continuation of the trend. Its resistance is at 93.87 and its support is at 92.76. A breakout above the resistance zone at 93.87–93.87 is likely to signal a continuation of the bullish trend.