 Română
 Русский
 English
 Bahasa Indonesia
 Bahasa Malay
 ไทย
ไทย Español
 Deutsch
 Български
 Français
 Tiếng Việt
 中文
中文 বাংলা
বাংলা हिन्दी
 Čeština
 Українська
FX.co ★ Patterns #MCD | McDonald's Corporation Stock Price

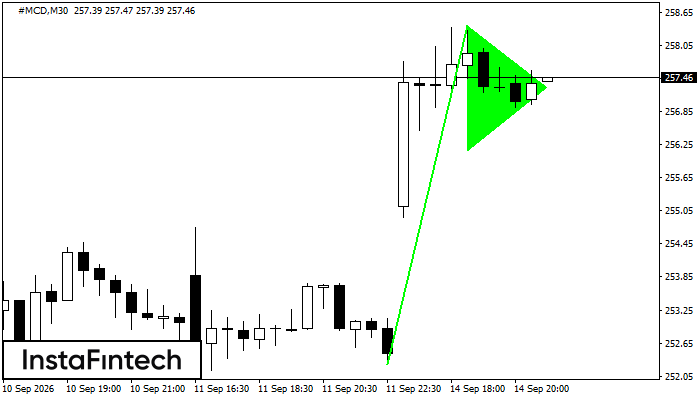
#MCD M30
Bullish Pennant
The Bullish Pennant pattern has formed on the #MCD M30 chart. This is a trend continuation pattern. If the price breaks above the pattern high at 258.41, the uptrend is expected to continue toward 258.71.
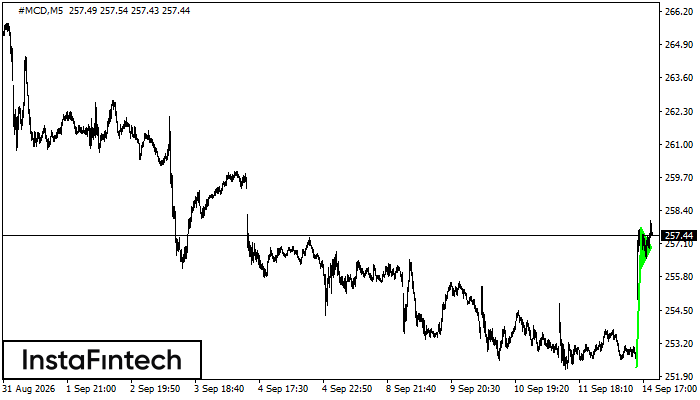
#MCD M5
Bullish Pennant
The Bullish Pennant pattern has formed on the #MCD M5 chart. This is a continuation pattern. If the price closes above the pennant high at 257.75, the uptrend is likely to continue.
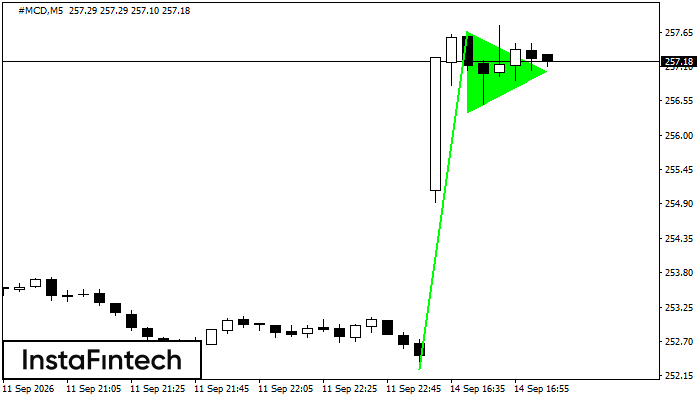
#MCD M5
Bullish Pennant
The Bullish Pennant pattern has formed on the #MCD M5 chart. This is a trend continuation pattern. If the price breaks above the pattern high at 257.66, the uptrend is expected to continue toward 257.81.
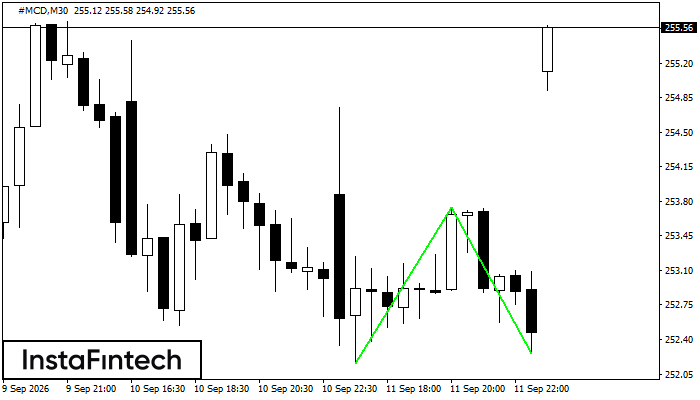
#MCD M30
Double Bottom
The Double Bottom pattern has formed on the #MCD M30 chart and signals a potential reversal from a downtrend to an uptrend. A long position may be considered after the price breaks above the upper boundary at 253.74. The projected move is based on the pattern width of 158 points.
#MCD M30
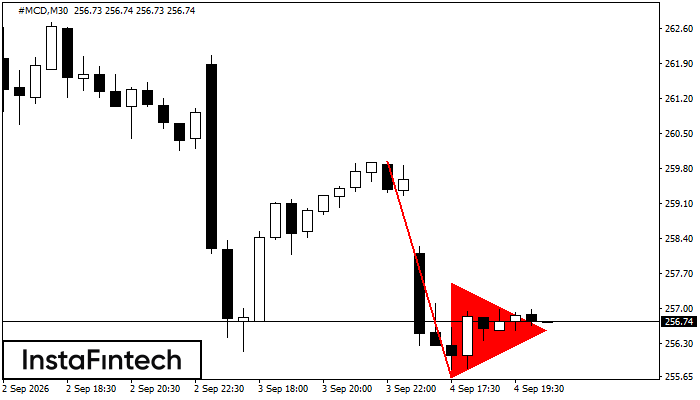
Bearish Pennant
The Bearish Pennant pattern has formed on the #MCD M30 chart. It represents a brief consolidation before the price potentially resumes the prevailing trend. A short position may be considered if the price closes below the pattern low at 255.62.
#MCD M15
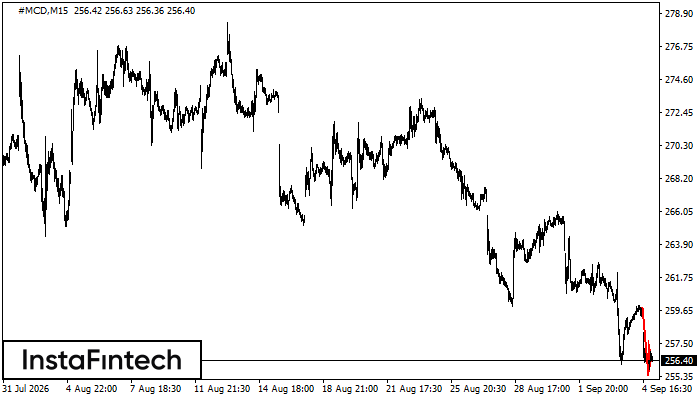
Bearish Pennant
The Bearish Pennant pattern has formed on the #MCD M15 chart. It represents a brief consolidation before the price potentially resumes the prevailing trend. A short position may be considered if the price closes below the pattern low at 255.42.
#MCD M5
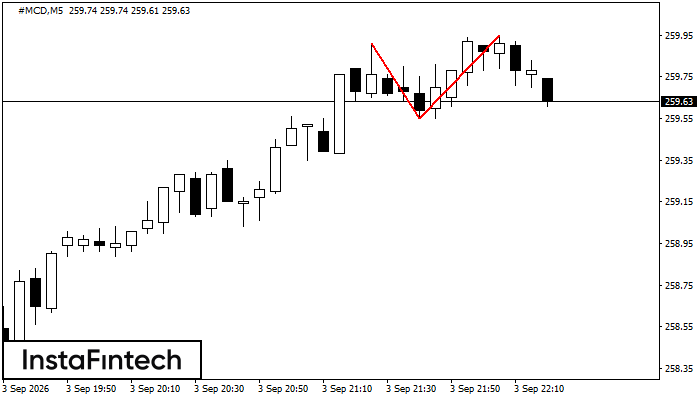
Double Top
The Double Top reversal pattern has formed on the #MCD M5 chart. Its upper boundary is at 259.91, its lower boundary is at 259.55, and its width is 40 points. A short position may be considered below the lower boundary at 259.55, with a potential target at 259.40.
#MCD H1
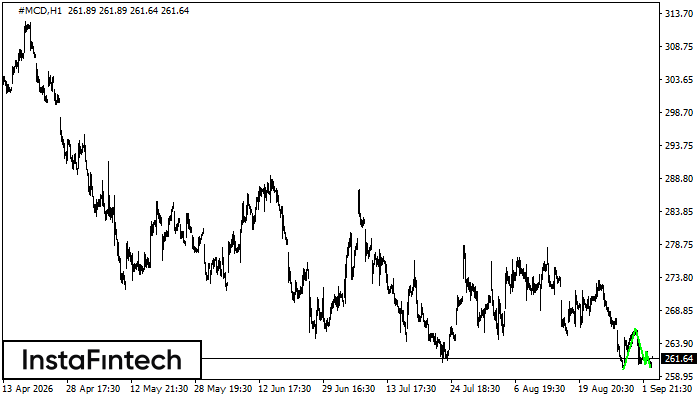
Triple Bottom
The Triple Bottom pattern has formed on the #MCD H1 chart. It has the following characteristics: resistance at 262.72; support at 260.17; pattern width of 255 points. If the confirmation resistance at 266.06 is broken, the price is likely to continue upward by at least 537 points.
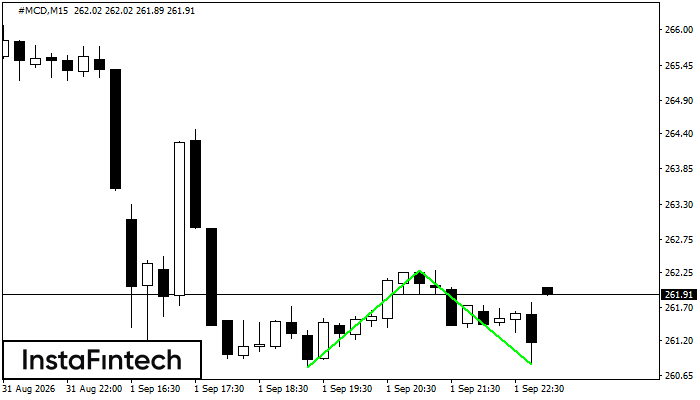
#MCD M15
Double Bottom
The Double Bottom pattern has formed on the #MCD M15 chart. Its upper boundary is at 262.28, its lower boundary is at 260.83, and its width is 150 points. A break above the upper boundary at 262.28 may confirm a trend reversal, with the pattern width defining the projected distance to a potential Take Profit level.
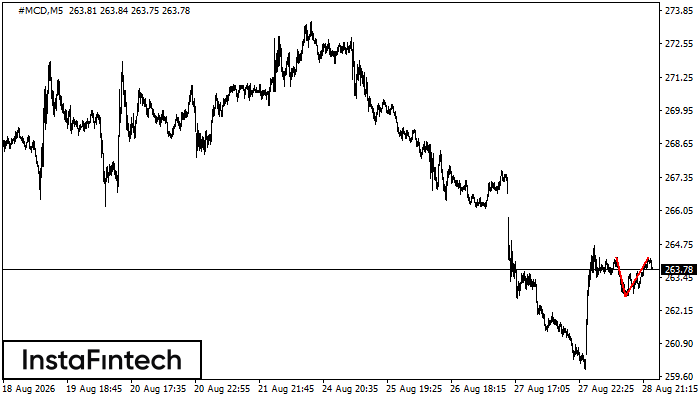
#MCD M5
Double Top
The Double Top reversal pattern has formed on the #MCD M5 chart. Its upper boundary is at 264.23, its lower boundary is at 262.72, and its width is 151 points. A break below the lower boundary is likely to confirm further downward movement toward 262.57.