 Română
  Русский
 English
 Bahasa Indonesia
 Bahasa Malay
 ไทย
ไทย Español
 Deutsch
 Български
 Français
 Tiếng Việt
 中文
中文 বাংলা
বাংলা हिन्दी
 Čeština
 Українська
FX.co ★ Patterns NZDCAD | New Zealand Dollar (NZD) to Canadian Dollar (CAD) Rate in the Forex market

NZDCAD M5
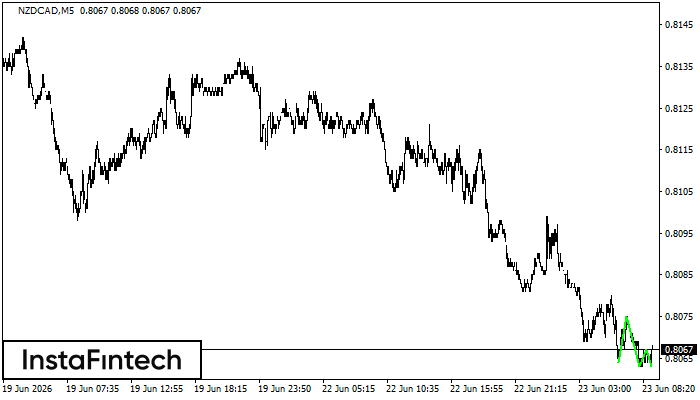
Triple Bottom
The Triple Bottom pattern has been formed on NZDCAD M5. It has the following characteristics: resistance level 0.8075/0.8067; support level 0.8064/0.8063; the width is 11 points. In the event of a breakdown of the resistance level of 0.8075, the price is likely to continue an upward movement at least to 0.8078.
NZDCAD M5
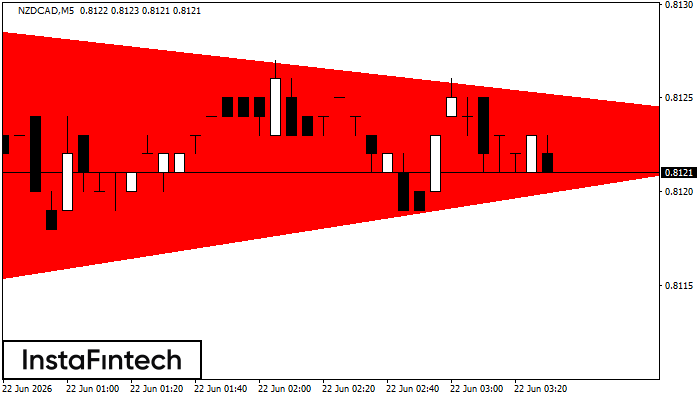
Bearish Symmetrical Triangle
According to the chart of M5, NZDCAD formed the Bearish Symmetrical Triangle pattern. Description: The lower border is 0.8115/0.8123 and upper border is 0.8129/0.8123. The pattern width is measured on the chart at -14 pips. The formation of the Bearish Symmetrical Triangle pattern evidently signals a continuation of the downward trend. In other words, if the scenario comes true and NZDCAD breaches the lower border, the price could continue its move toward 0.8108.
NZDCAD M5
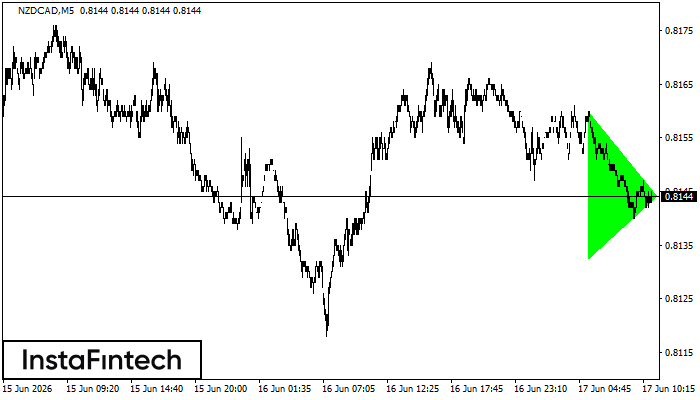
Bullish Symmetrical Triangle
According to the chart of M5, NZDCAD formed the Bullish Symmetrical Triangle pattern. The lower border of the pattern touches the coordinates 0.8132/0.8144 whereas the upper border goes across 0.8160/0.8144. If the Bullish Symmetrical Triangle pattern is in progress, this evidently signals a further upward trend. In other words, in case the scenario comes true, the price of NZDCAD will breach the upper border to head for 0.8159.
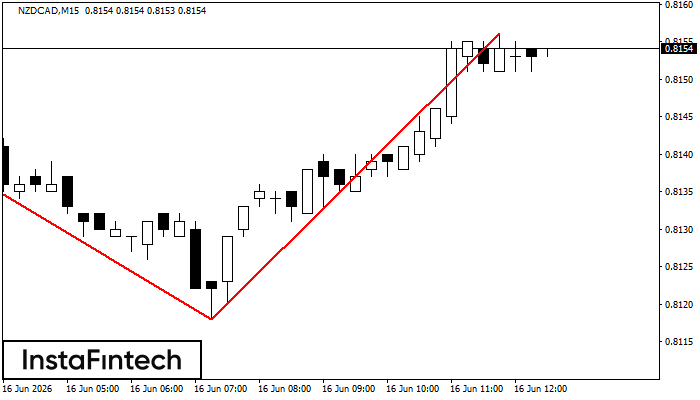
NZDCAD M15
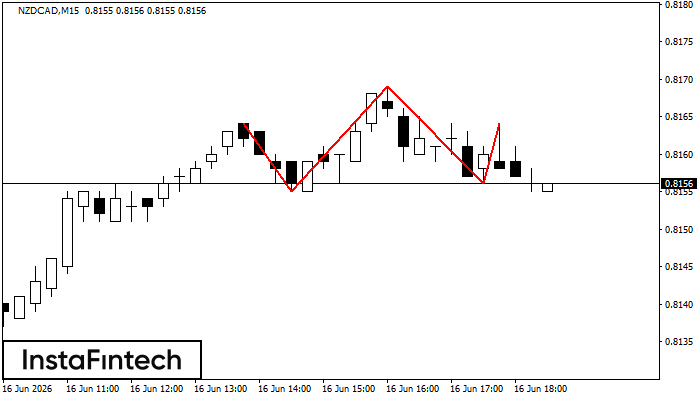
Head and Shoulders
The NZDCAD M15 formed the Head and Shoulders pattern with the following features: The Head’s top is at 0.8169, the Neckline and the upward angle are at 0.8155/0.8156. The formation of this pattern can bring about changes in the current trend from bullish to bearish. In case the pattern triggers the expected changes, the price of NZDCAD will go towards 0.8134.
NZDCAD M15
Double Top
The Double Top reversal pattern has been formed on NZDCAD M15. Characteristics: the upper boundary 0.8155; the lower boundary 0.8118; the width of the pattern is 38 points. Sell trades are better to be opened below the lower boundary 0.8118 with a possible movements towards the 0.8095 level.
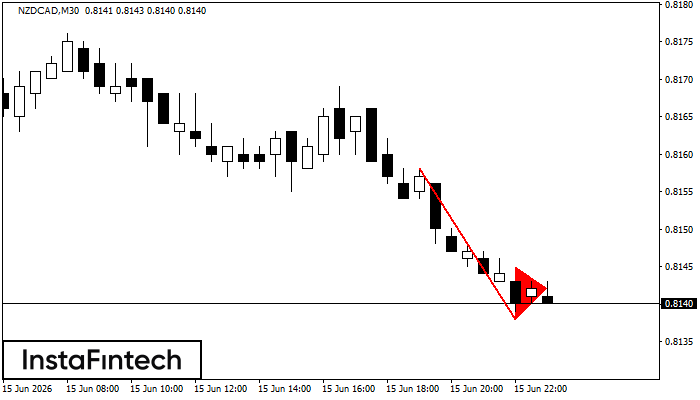
NZDCAD M30
Bearish pennant
The Bearish pennant pattern has formed on the NZDCAD M30 chart. It signals potential continuation of the existing trend. Specifications: the pattern’s bottom has the coordinate of 0.8138; the projection of the flagpole height is equal to 20 pips. In case the price breaks out the pattern’s bottom of 0.8138, the downtrend is expected to continue for further level 0.8108.
NZDCAD M5
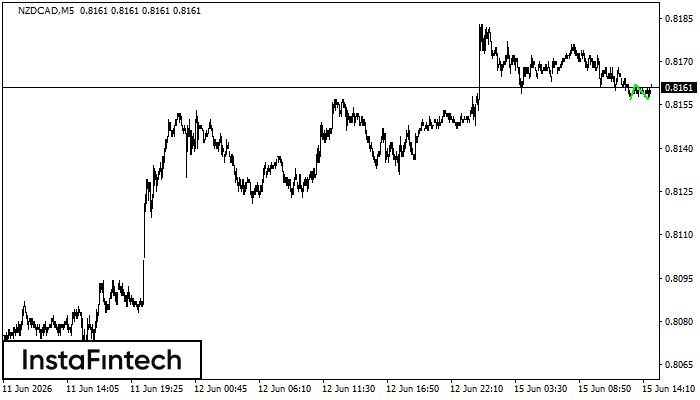
Double Bottom
The Double Bottom pattern has been formed on NZDCAD M5. Characteristics: the support level 0.8157; the resistance level 0.8162; the width of the pattern 5 points. If the resistance level is broken, a change in the trend can be predicted with the first target point lying at the distance of 5 points.
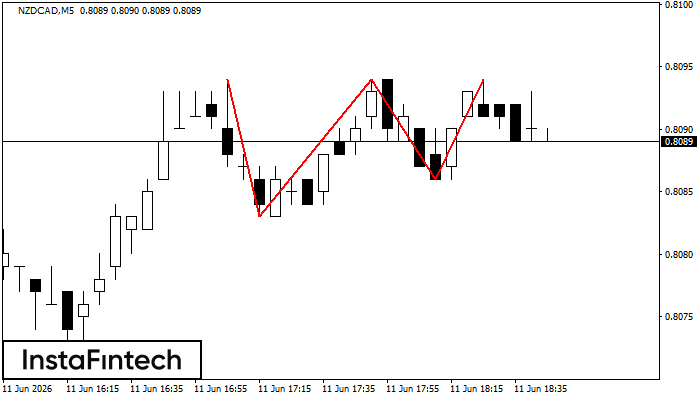
NZDCAD M5
Triple Top
The Triple Top pattern has formed on the chart of the NZDCAD M5 trading instrument. It is a reversal pattern featuring the following characteristics: resistance level 0, support level -3, and pattern’s width 11. Forecast If the price breaks through the support level 0.8083, it is likely to move further down to 0.8079.
NZDCAD H1
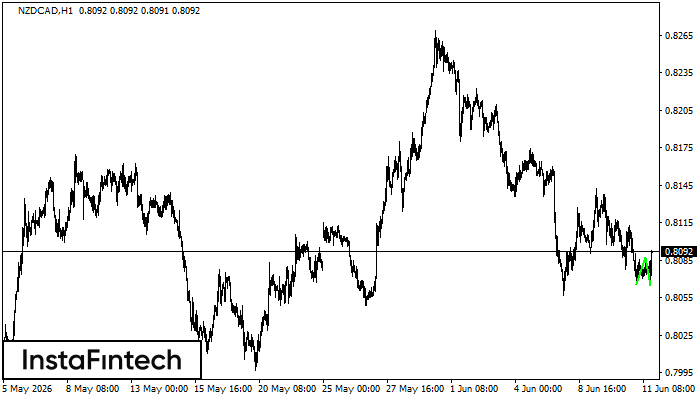
Double Bottom
The Double Bottom pattern has been formed on NZDCAD H1; the upper boundary is 0.8087; the lower boundary is 0.8065. The width of the pattern is 21 points. In case of a break of the upper boundary 0.8087, a change in the trend can be predicted where the width of the pattern will coincide with the distance to a possible take profit level.
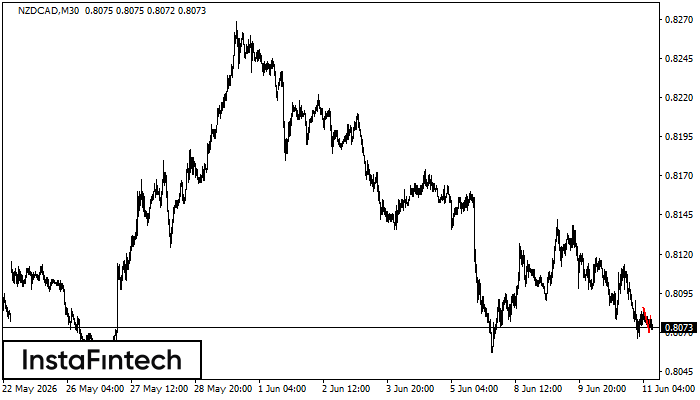
NZDCAD M30
Bearish Flag
The Bearish Flag pattern has been formed on the chart NZDCAD M30 which signals that the downward trend will continue. If the price breaks below the low at 0.8070, then it is most likely to move further downwards. The price will likely move by the number of points which equals the length of the flag pole (20 points).