 Română
  Русский
 English
 Bahasa Indonesia
 Bahasa Malay
 ไทย
ไทย Español
 Deutsch
 Български
 Français
 Tiếng Việt
 中文
中文 বাংলা
বাংলা हिन्दी
 Čeština
 Українська
FX.co ★ Patterns USDCHF | US Dollar (USD) to Swiss Franc (CHF) Rate in the Forex market

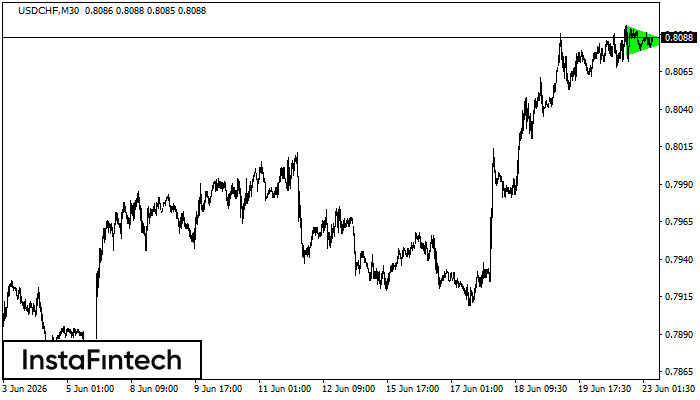
USDCHF M30
Bullish Symmetrical Triangle
According to the chart of M30, USDCHF formed the Bullish Symmetrical Triangle pattern, which signals the trend will continue. Description. The upper border of the pattern touches the coordinates 0.8096/0.8085 whereas the lower border goes across 0.8076/0.8085. The pattern width is measured on the chart at 20 pips. If the Bullish Symmetrical Triangle pattern is in progress during the upward trend, this indicates the current trend will go on. In case 0.8085 is broken, the price could continue its move toward 0.8115.
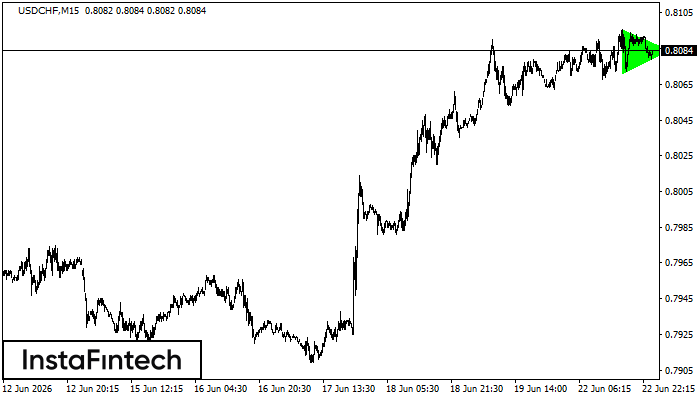
USDCHF M15
Bullish Symmetrical Triangle
According to the chart of M15, USDCHF formed the Bullish Symmetrical Triangle pattern. Description: This is the pattern of a trend continuation. 0.8096 and 0.8071 are the coordinates of the upper and lower borders respectively. The pattern width is measured on the chart at 25 pips. Outlook: If the upper border 0.8096 is broken, the price is likely to continue its move by 0.8106.
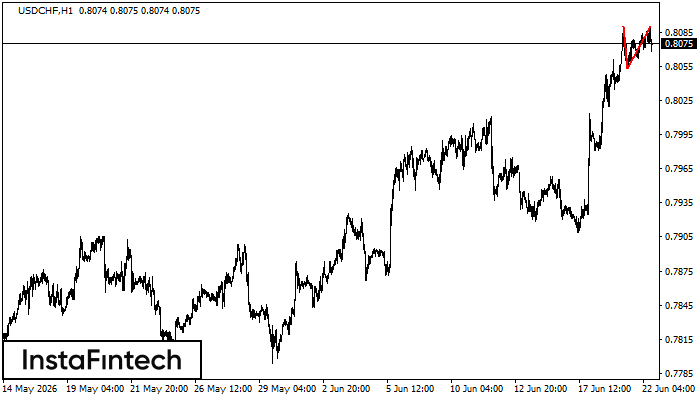
USDCHF H1
Double Top
On the chart of USDCHF H1 the Double Top reversal pattern has been formed. Characteristics: the upper boundary 0.8090; the lower boundary 0.8053; the width of the pattern 37 points. The signal: a break of the lower boundary will cause continuation of the downward trend targeting the 0.8013 level.
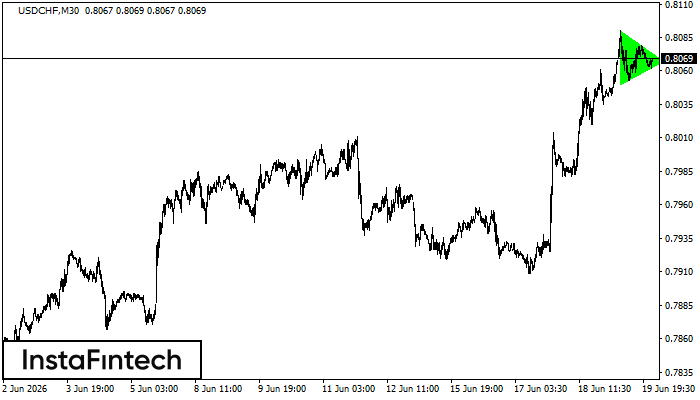
USDCHF M30
Bullish Symmetrical Triangle
According to the chart of M30, USDCHF formed the Bullish Symmetrical Triangle pattern. The lower border of the pattern touches the coordinates 0.8050/0.8067 whereas the upper border goes across 0.8090/0.8067. If the Bullish Symmetrical Triangle pattern is in progress, this evidently signals a further upward trend. In other words, in case the scenario comes true, the price of USDCHF will breach the upper border to head for 0.8097.
USDCHF M5
Double Top
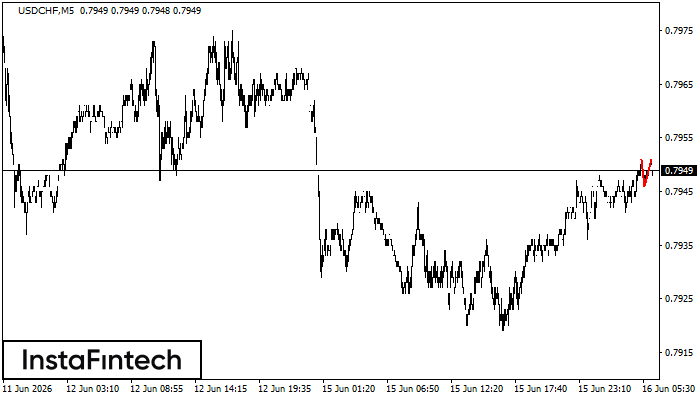
The Double Top reversal pattern has been formed on USDCHF M5. Characteristics: the upper boundary 0.7951; the lower boundary 0.7946; the width of the pattern is 5 points. Sell trades are better to be opened below the lower boundary 0.7946 with a possible movements towards the 0.7931 level.
USDCHF M30
Triple Top
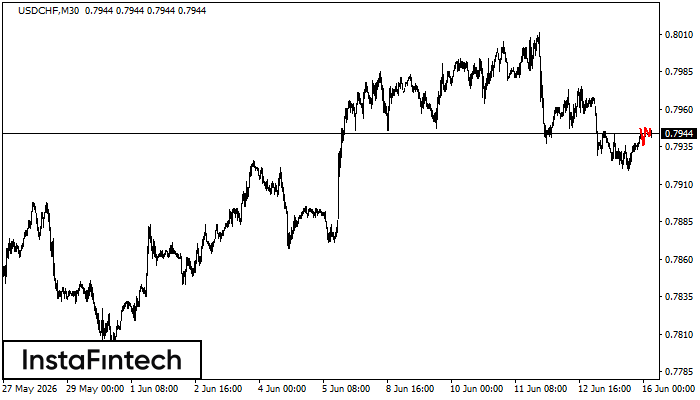
On the chart of the USDCHF M30 trading instrument, the Triple Top pattern that signals a trend change has formed. It is possible that after formation of the third peak, the price will try to break through the resistance level 0.7936, where we advise to open a trading position for sale. Take profit is the projection of the pattern’s width, which is 11 points.
USDCHF M5
Triple Top
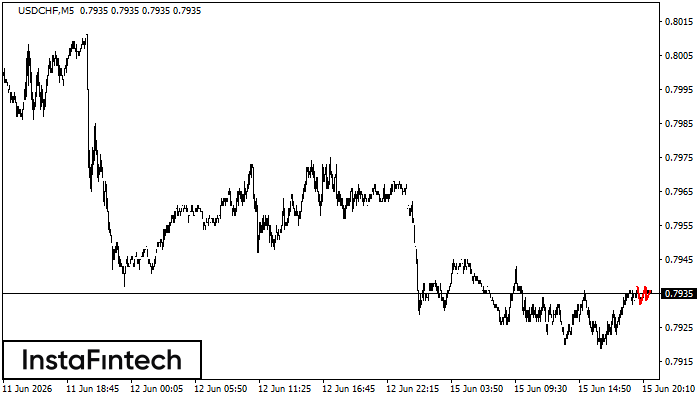
On the chart of the USDCHF M5 trading instrument, the Triple Top pattern that signals a trend change has formed. It is possible that after formation of the third peak, the price will try to break through the resistance level 0.7932, where we advise to open a trading position for sale. Take profit is the projection of the pattern’s width, which is 5 points.
USDCHF M5
Double Top
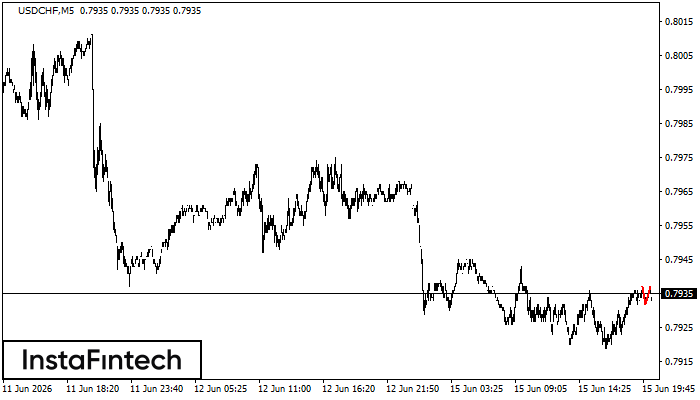
The Double Top pattern has been formed on USDCHF M5. It signals that the trend has been changed from upwards to downwards. Probably, if the base of the pattern 0.7932 is broken, the downward movement will continue.
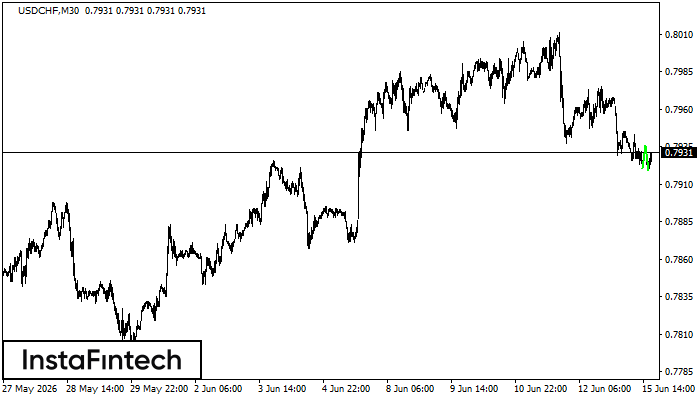
USDCHF M30
Double Bottom
The Double Bottom pattern has been formed on USDCHF M30. Characteristics: the support level 0.7920; the resistance level 0.7936; the width of the pattern 16 points. If the resistance level is broken, a change in the trend can be predicted with the first target point lying at the distance of 17 points.
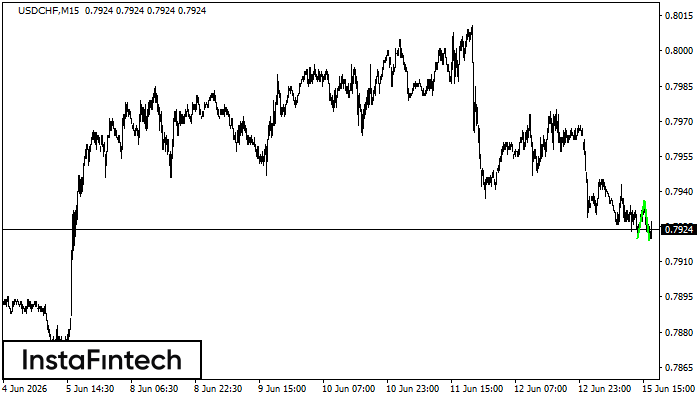
USDCHF M15
Double Bottom
The Double Bottom pattern has been formed on USDCHF M15. This formation signals a reversal of the trend from downwards to upwards. The signal is that a buy trade should be opened after the upper boundary of the pattern 0.7936 is broken. The further movements will rely on the width of the current pattern 16 points.