 中文
中文  Русский
 English
 Bahasa Indonesia
 Bahasa Malay
 ไทย
ไทย Español
 Deutsch
 Български
 Français
 Tiếng Việt
 বাংলা
বাংলা हिन्दी
 Čeština
 Українська
 Română
FX.co ★ Patterns AUDCAD | Australian Dollar (AUD) to Canadian Dollar (CAD) Rate in the Forex market

AUDCAD M5
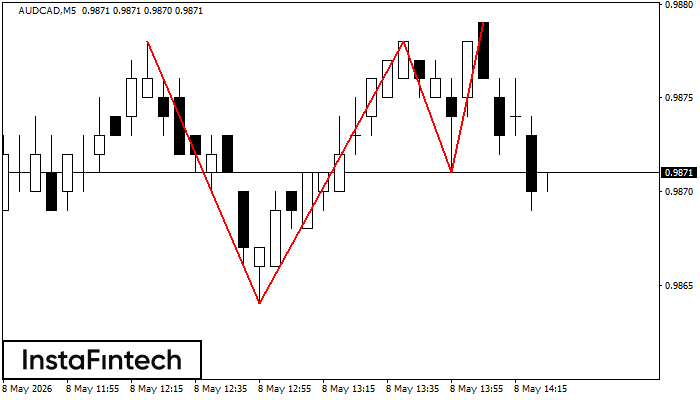
Triple Top
On the chart of the AUDCAD M5 trading instrument, the Triple Top pattern that signals a trend change has formed. It is possible that after formation of the third peak, the price will try to break through the resistance level 0.9864, where we advise to open a trading position for sale. Take profit is the projection of the pattern’s width, which is 14 points.
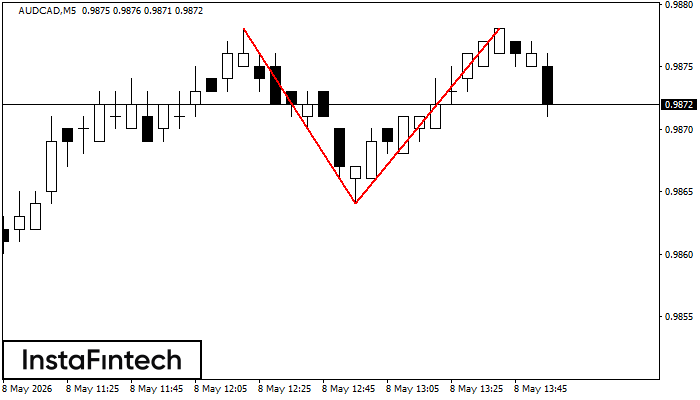
AUDCAD M5
Double Top
The Double Top pattern has been formed on AUDCAD M5. It signals that the trend has been changed from upwards to downwards. Probably, if the base of the pattern 0.9864 is broken, the downward movement will continue.
AUDCAD M5
Double Top
On the chart of AUDCAD M5 the Double Top reversal pattern has been formed. Characteristics: the upper boundary 0.9877; the lower boundary 0.9869; the width of the pattern 8 points. The signal: a break of the lower boundary will cause continuation of the downward trend targeting the 0.9854 level.
AUDCAD M5
Bullish Rectangle
According to the chart of M5, AUDCAD formed the Bullish Rectangle. This type of a pattern indicates a trend continuation. It consists of two levels: resistance 0.9877 and support 0.9869. In case the resistance level 0.9877 - 0.9877 is broken, the instrument is likely to follow the bullish trend.
AUDCAD M5
Double Bottom
The Double Bottom pattern has been formed on AUDCAD M5; the upper boundary is 0.9855; the lower boundary is 0.9838. The width of the pattern is 18 points. In case of a break of the upper boundary 0.9855, a change in the trend can be predicted where the width of the pattern will coincide with the distance to a possible take profit level.
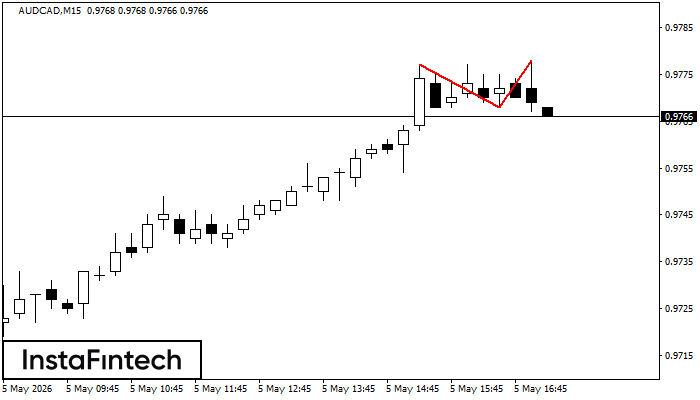
AUDCAD M15
Double Top
The Double Top reversal pattern has been formed on AUDCAD M15. Characteristics: the upper boundary 0.9777; the lower boundary 0.9768; the width of the pattern is 10 points. Sell trades are better to be opened below the lower boundary 0.9768 with a possible movements towards the 0.9746 level.
AUDCAD M5
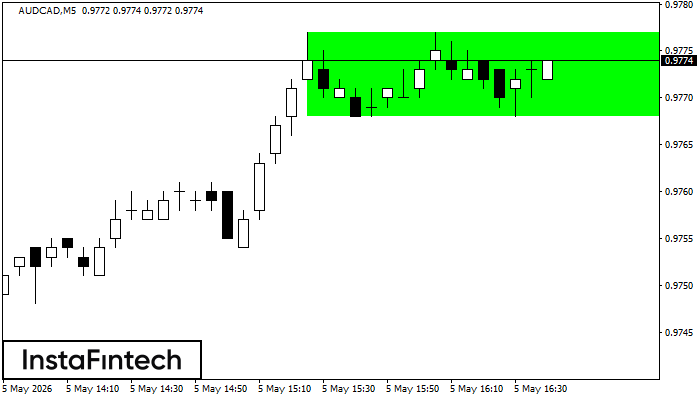
Bullish Rectangle
According to the chart of M5, AUDCAD formed the Bullish Rectangle. The pattern indicates a trend continuation. The upper border is 0.9777, the lower border is 0.9768. The signal means that a long position should be opened above the upper border 0.9777 of the Bullish Rectangle.
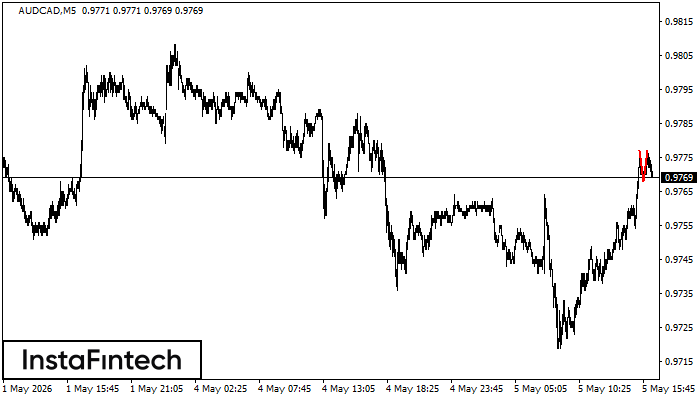
AUDCAD M5
Double Top
The Double Top reversal pattern has been formed on AUDCAD M5. Characteristics: the upper boundary 0.9777; the lower boundary 0.9768; the width of the pattern is 9 points. Sell trades are better to be opened below the lower boundary 0.9768 with a possible movements towards the 0.9753 level.
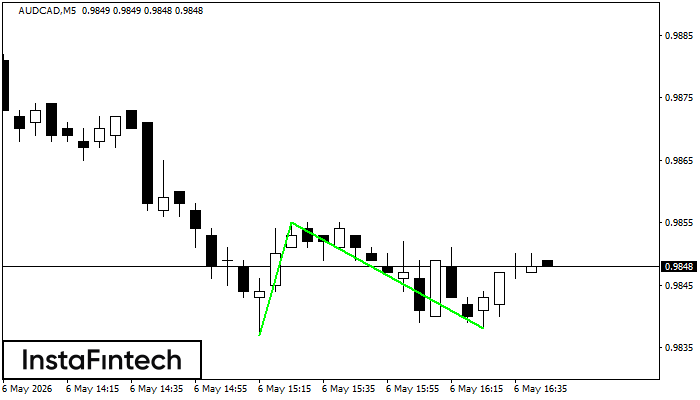
AUDCAD M5
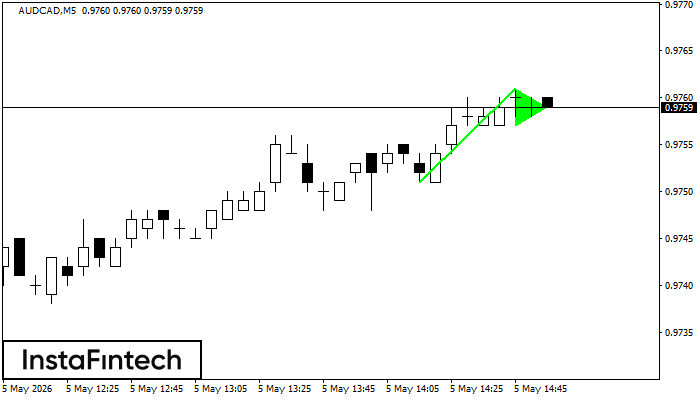
Bullish pennant
The Bullish pennant pattern is formed on the AUDCAD M5 chart. It is a type of the continuation pattern. Supposedly, in case the price is fixed above the pennant’s high of 0.9761, a further uptrend is possible.
AUDCAD M5
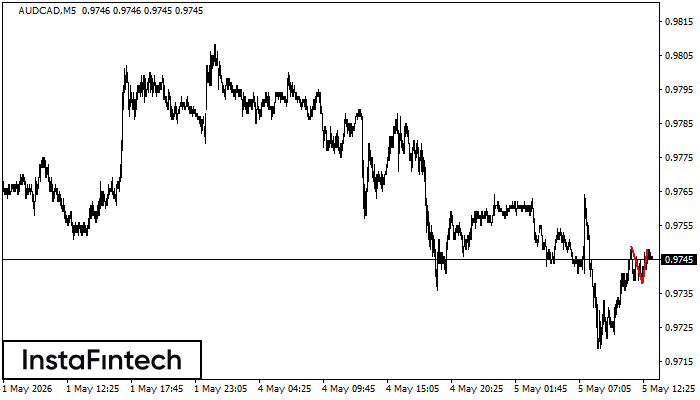
Double Top
The Double Top pattern has been formed on AUDCAD M5. It signals that the trend has been changed from upwards to downwards. Probably, if the base of the pattern 0.9738 is broken, the downward movement will continue.