 中文
中文  Русский
 English
 Bahasa Indonesia
 Bahasa Malay
 ไทย
ไทย Español
 Deutsch
 Български
 Français
 Tiếng Việt
 বাংলা
বাংলা हिन्दी
 Čeština
 Українська
 Română
FX.co ★ Patterns AUDJPY | Australian Dollar (AUD) to Japanese Yen (JPY) Rate in the Forex market

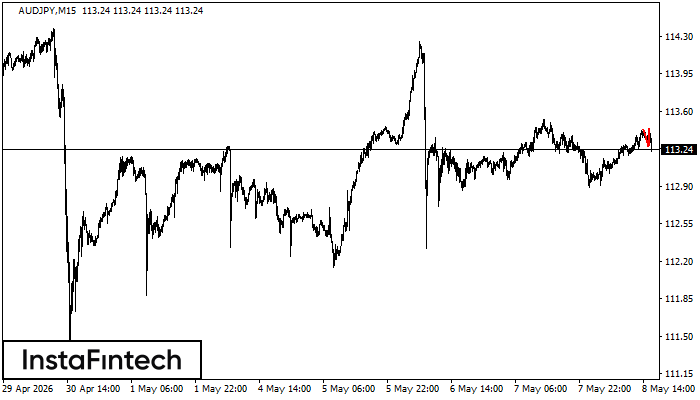
AUDJPY M15
Double Top
The Double Top reversal pattern has been formed on AUDJPY M15. Characteristics: the upper boundary 113.43; the lower boundary 113.27; the width of the pattern is 17 points. Sell trades are better to be opened below the lower boundary 113.27 with a possible movements towards the 113.04 level.
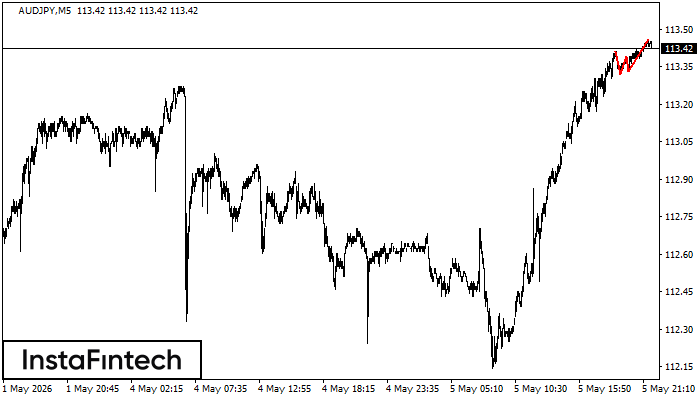
AUDJPY M5
Triple Top
On the chart of the AUDJPY M5 trading instrument, the Triple Top pattern that signals a trend change has formed. It is possible that after formation of the third peak, the price will try to break through the resistance level 113.32, where we advise to open a trading position for sale. Take profit is the projection of the pattern’s width, which is 9 points.
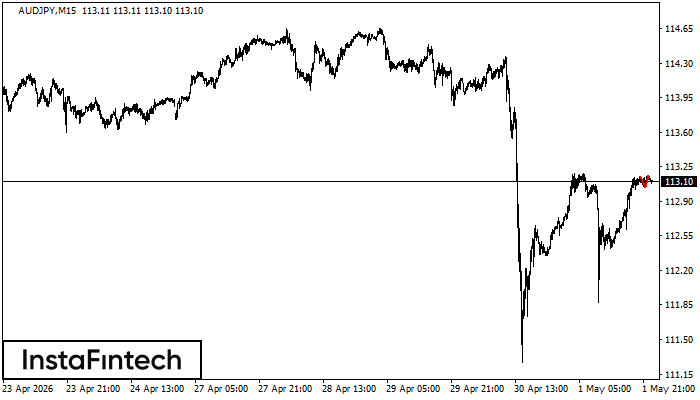
AUDJPY M15
Double Top
The Double Top pattern has been formed on AUDJPY M15. It signals that the trend has been changed from upwards to downwards. Probably, if the base of the pattern 113.02 is broken, the downward movement will continue.
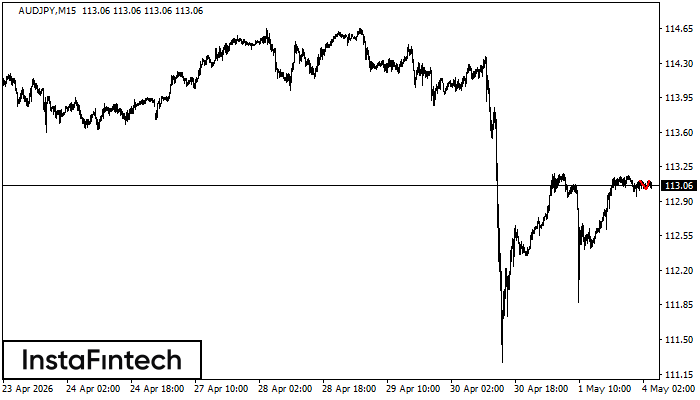
AUDJPY M15
Double Top
On the chart of AUDJPY M15 the Double Top reversal pattern has been formed. Characteristics: the upper boundary 113.16; the lower boundary 113.04; the width of the pattern 12 points. The signal: a break of the lower boundary will cause continuation of the downward trend targeting the 112.82 level.
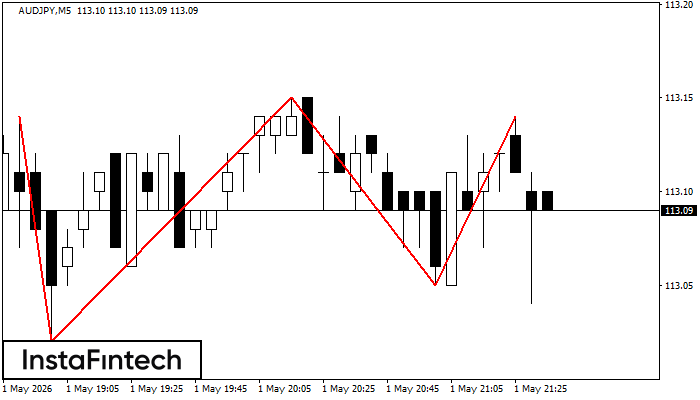
AUDJPY M5
Triple Top
The Triple Top pattern has formed on the chart of the AUDJPY M5. Features of the pattern: borders have an ascending angle; the lower line of the pattern has the coordinates 113.02/113.05 with the upper limit 113.14/113.14; the projection of the width is 12 points. The formation of the Triple Top figure most likely indicates a change in the trend from upward to downward. This means that in the event of a breakdown of the support level of 113.02, the price is most likely to continue the downward movement.
AUDJPY M5
Triple Top
The Triple Top pattern has formed on the chart of the AUDJPY M5. Features of the pattern: borders have an ascending angle; the lower line of the pattern has the coordinates 112.99/113.10 with the upper limit 113.18/113.18; the projection of the width is 19 points. The formation of the Triple Top figure most likely indicates a change in the trend from upward to downward. This means that in the event of a breakdown of the support level of 112.99, the price is most likely to continue the downward movement.
AUDJPY M5
Double Top
On the chart of AUDJPY M5 the Double Top reversal pattern has been formed. Characteristics: the upper boundary 113.17; the lower boundary 112.99; the width of the pattern 18 points. The signal: a break of the lower boundary will cause continuation of the downward trend targeting the 112.84 level.
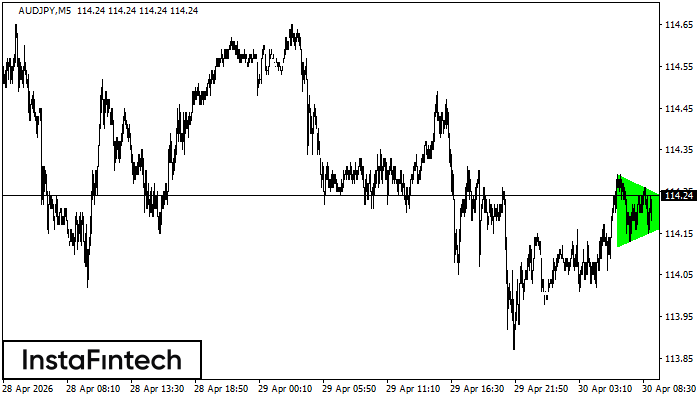
AUDJPY M5
Bullish Symmetrical Triangle
According to the chart of M5, AUDJPY formed the Bullish Symmetrical Triangle pattern. Description: This is the pattern of a trend continuation. 114.29 and 114.12 are the coordinates of the upper and lower borders respectively. The pattern width is measured on the chart at 17 pips. Outlook: If the upper border 114.29 is broken, the price is likely to continue its move by 114.35.
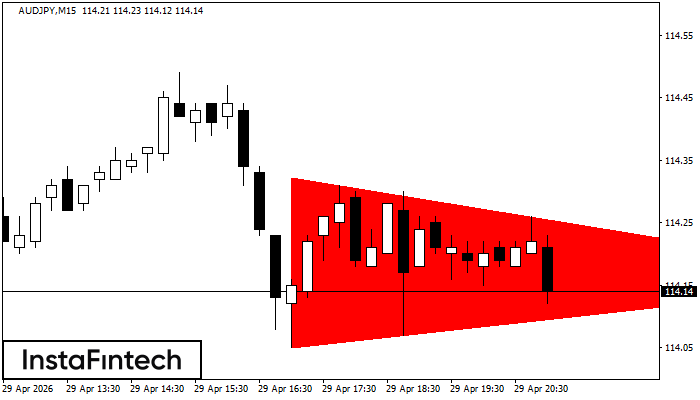
AUDJPY M15
Bearish Symmetrical Triangle
According to the chart of M15, AUDJPY formed the Bearish Symmetrical Triangle pattern. This pattern signals a further downward trend in case the lower border 114.05 is breached. Here, a hypothetical profit will equal the width of the available pattern that is -27 pips.
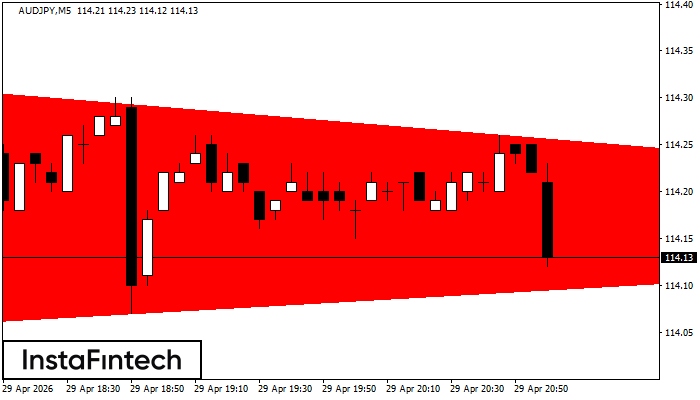
AUDJPY M5
Bearish Symmetrical Triangle
According to the chart of M5, AUDJPY formed the Bearish Symmetrical Triangle pattern. Trading recommendations: A breach of the lower border 114.05 is likely to encourage a continuation of the downward trend.