 中文
中文  Русский
 English
 Bahasa Indonesia
 Bahasa Malay
 ไทย
ไทย Español
 Deutsch
 Български
 Français
 Tiếng Việt
 বাংলা
বাংলা हिन्दी
 Čeština
 Українська
 Română
FX.co ★ Patterns AUDUSD | Australian Dollar (AUD) to US Dollar (USD) Rate in the Forex market

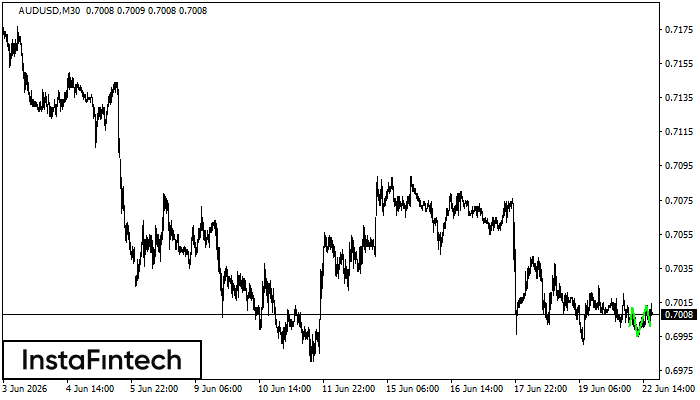
AUDUSD M30
Inverse Head and Shoulder
According to M30, AUDUSD is shaping the technical pattern – the Inverse Head and Shoulder. In case the Neckline 0.7012/0.7013 is broken out, the instrument is likely to move toward 0.7043.
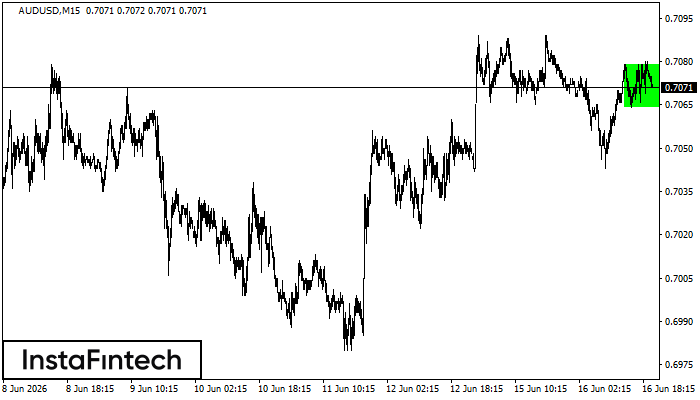
AUDUSD M15
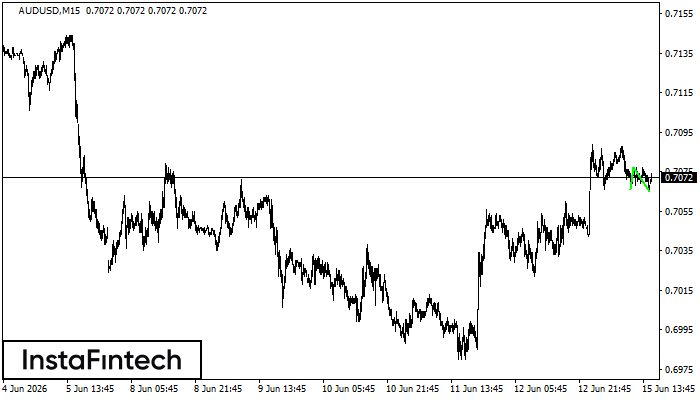
Bullish Rectangle
According to the chart of M15, AUDUSD formed the Bullish Rectangle. The pattern indicates a trend continuation. The upper border is 0.7079, the lower border is 0.7064. The signal means that a long position should be opened above the upper border 0.7079 of the Bullish Rectangle.
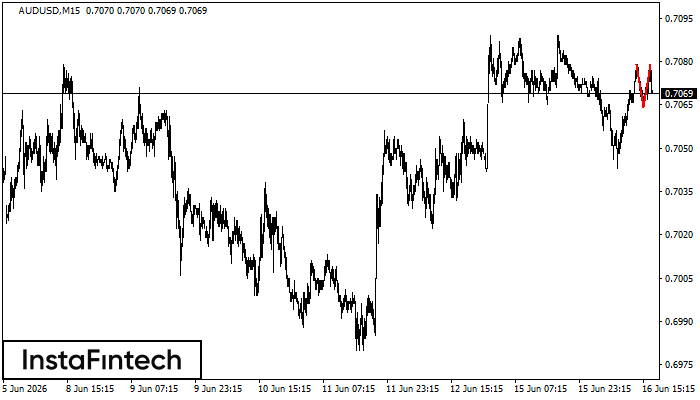
AUDUSD M15
Double Top
The Double Top pattern has been formed on AUDUSD M15. It signals that the trend has been changed from upwards to downwards. Probably, if the base of the pattern 0.7064 is broken, the downward movement will continue.
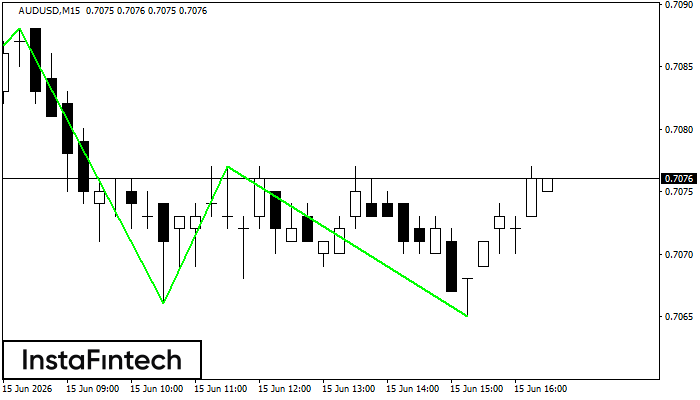
AUDUSD M15
Triple Bottom
The Triple Bottom pattern has formed on the chart of the AUDUSD M15 trading instrument. The pattern signals a change in the trend from downwards to upwards in the case of breakdown of 0.7088/0.7077.
AUDUSD M15
Double Bottom
The Double Bottom pattern has been formed on AUDUSD M15. This formation signals a reversal of the trend from downwards to upwards. The signal is that a buy trade should be opened after the upper boundary of the pattern 0.7077 is broken. The further movements will rely on the width of the current pattern 11 points.
AUDUSD M30
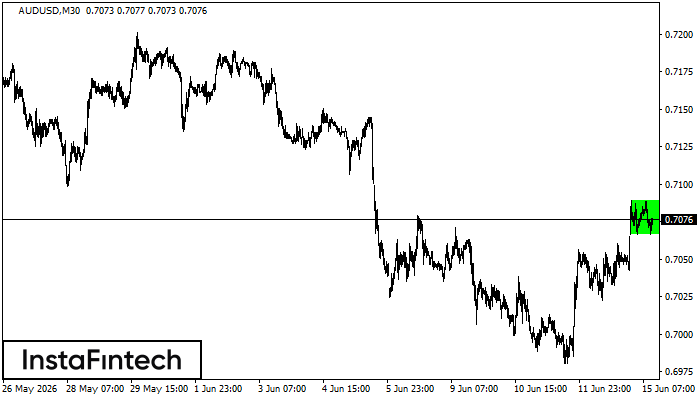
Bullish Rectangle
According to the chart of M30, AUDUSD formed the Bullish Rectangle. The pattern indicates a trend continuation. The upper border is 0.7089, the lower border is 0.7066. The signal means that a long position should be opened above the upper border 0.7089 of the Bullish Rectangle.
AUDUSD M15
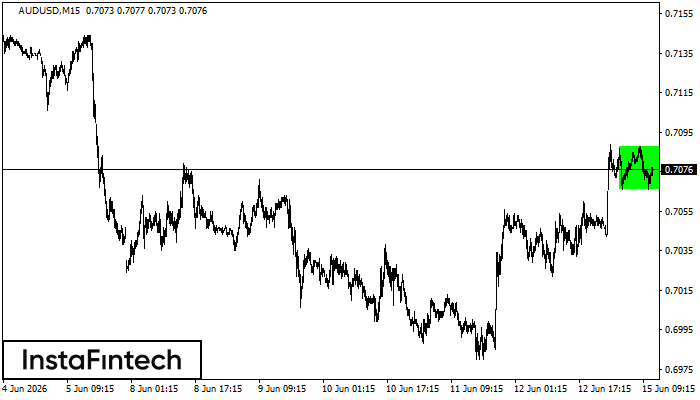
Bullish Rectangle
According to the chart of M15, AUDUSD formed the Bullish Rectangle which is a pattern of a trend continuation. The pattern is contained within the following borders: the lower border 0.7066 – 0.7066 and upper border 0.7088 – 0.7088. In case the upper border is broken, the instrument is likely to follow the upward trend.

AUDUSD M15
Bullish Rectangle
According to the chart of M15, AUDUSD formed the Bullish Rectangle. This type of a pattern indicates a trend continuation. It consists of two levels: resistance 0.7088 and support 0.7066. In case the resistance level 0.7088 - 0.7088 is broken, the instrument is likely to follow the bullish trend.
AUDUSD M30
Double Top
The Double Top pattern has been formed on AUDUSD M30. It signals that the trend has been changed from upwards to downwards. Probably, if the base of the pattern 0.7066 is broken, the downward movement will continue.
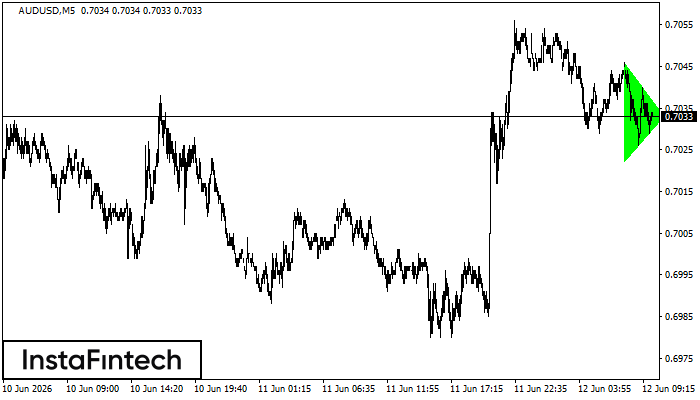
AUDUSD M5
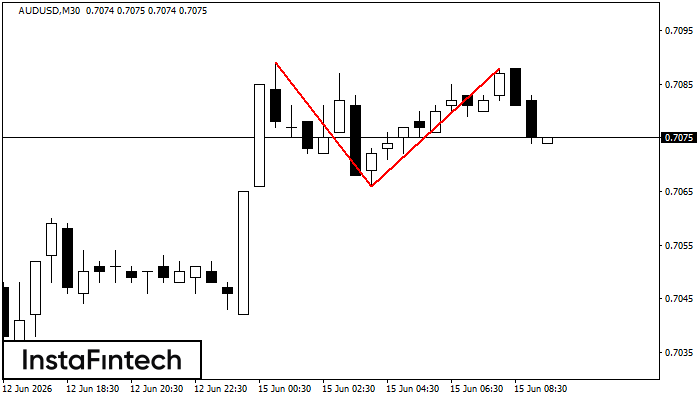
Bullish Symmetrical Triangle
According to the chart of M5, AUDUSD formed the Bullish Symmetrical Triangle pattern. Description: This is the pattern of a trend continuation. 0.7046 and 0.7022 are the coordinates of the upper and lower borders respectively. The pattern width is measured on the chart at 24 pips. Outlook: If the upper border 0.7046 is broken, the price is likely to continue its move by 0.7048.