 中文
中文  Русский
 English
 Bahasa Indonesia
 Bahasa Malay
 ไทย
ไทย Español
 Deutsch
 Български
 Français
 Tiếng Việt
 বাংলা
বাংলা हिन्दी
 Čeština
 Українська
 Română
FX.co ★ Patterns GBPAUD | British Pound (GBP) to Australian Dollar (AUD) Rate in the Forex market

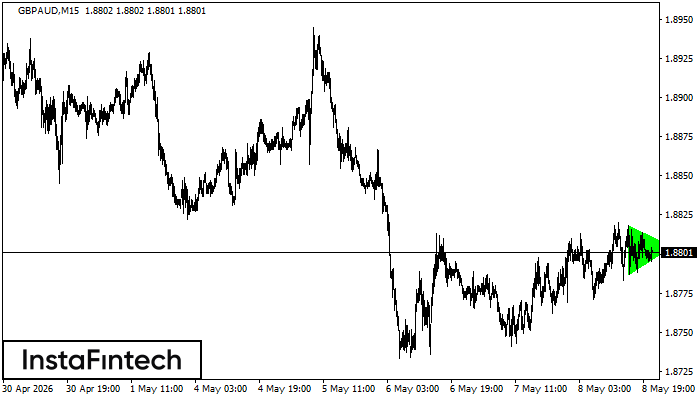
GBPAUD M15
Bullish Symmetrical Triangle
According to the chart of M15, GBPAUD formed the Bullish Symmetrical Triangle pattern. Description: This is the pattern of a trend continuation. 1.8818 and 1.8787 are the coordinates of the upper and lower borders respectively. The pattern width is measured on the chart at 31 pips. Outlook: If the upper border 1.8818 is broken, the price is likely to continue its move by 1.8828.
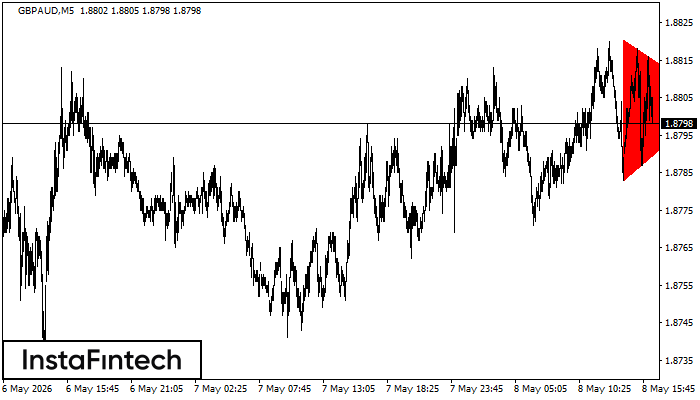
GBPAUD M5
Bearish Symmetrical Triangle
According to the chart of M5, GBPAUD formed the Bearish Symmetrical Triangle pattern. This pattern signals a further downward trend in case the lower border 1.8783 is breached. Here, a hypothetical profit will equal the width of the available pattern that is -38 pips.
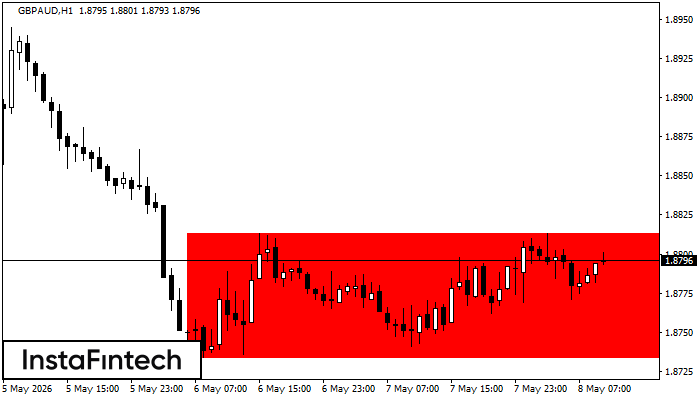
GBPAUD H1
Bearish Rectangle
According to the chart of H1, GBPAUD formed the Bearish Rectangle. This type of a pattern indicates a trend continuation. It consists of two levels: resistance 1.8813 - 0.0000 and support 1.8733 – 1.8733. In case the resistance level 1.8733 - 1.8733 is broken, the instrument is likely to follow the bearish trend.
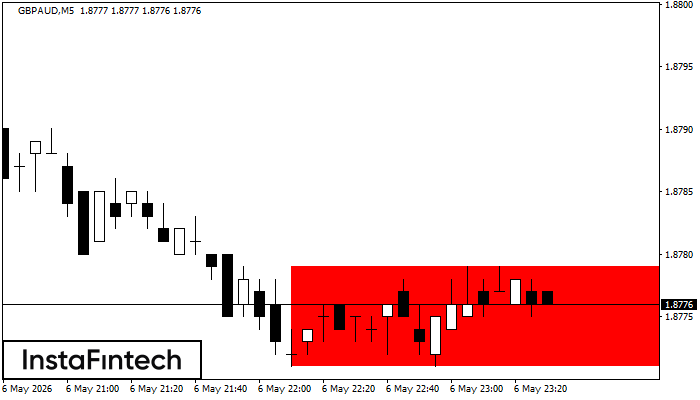
GBPAUD M5
Bearish Rectangle
According to the chart of M5, GBPAUD formed the Bearish Rectangle. The pattern indicates a trend continuation. The upper border is 1.8779, the lower border is 1.8771. The signal means that a short position should be opened after fixing a price below the lower border 1.8771 of the Bearish Rectangle.
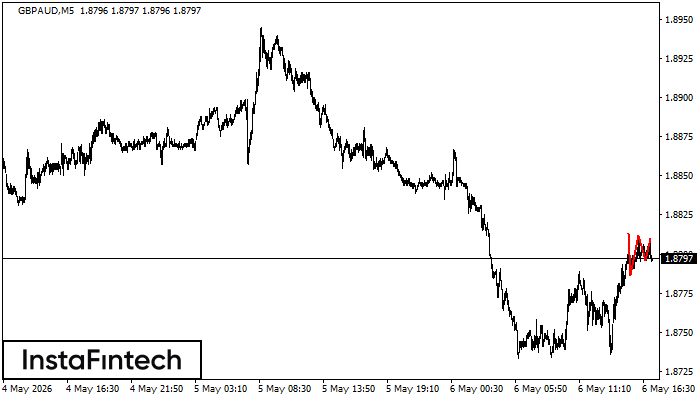
GBPAUD M5
Triple Top
The Triple Top pattern has formed on the chart of the GBPAUD M5. Features of the pattern: borders have an ascending angle; the lower line of the pattern has the coordinates 1.8786/1.8796 with the upper limit 1.8813/1.8810; the projection of the width is 27 points. The formation of the Triple Top figure most likely indicates a change in the trend from upward to downward. This means that in the event of a breakdown of the support level of 1.8786, the price is most likely to continue the downward movement.
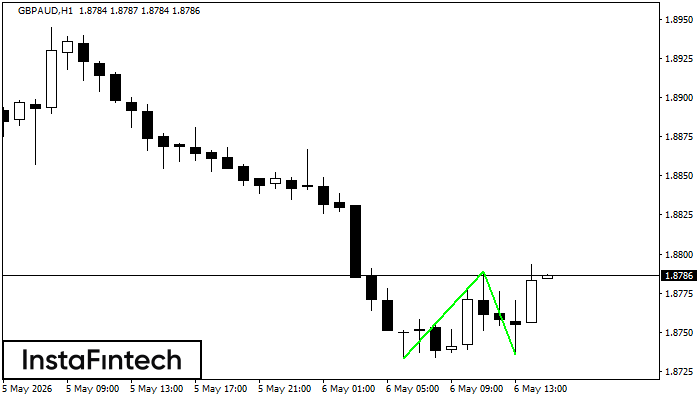
GBPAUD H1
Double Bottom
The Double Bottom pattern has been formed on GBPAUD H1. This formation signals a reversal of the trend from downwards to upwards. The signal is that a buy trade should be opened after the upper boundary of the pattern 1.8789 is broken. The further movements will rely on the width of the current pattern 56 points.
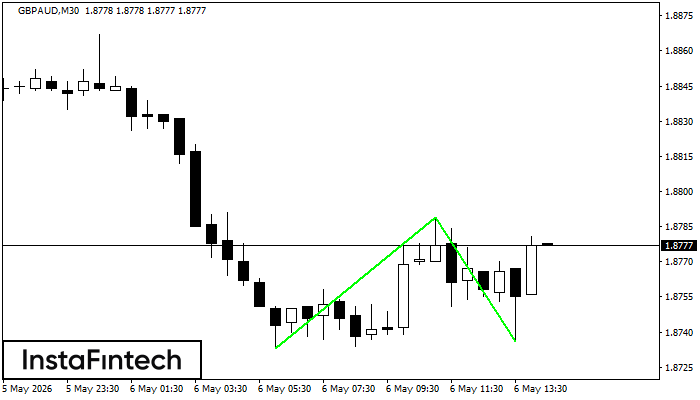
GBPAUD M30
Double Bottom
The Double Bottom pattern has been formed on GBPAUD M30; the upper boundary is 1.8789; the lower boundary is 1.8736. The width of the pattern is 56 points. In case of a break of the upper boundary 1.8789, a change in the trend can be predicted where the width of the pattern will coincide with the distance to a possible take profit level.
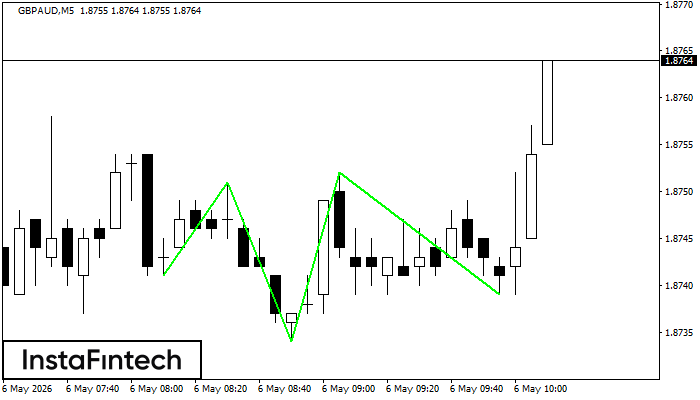
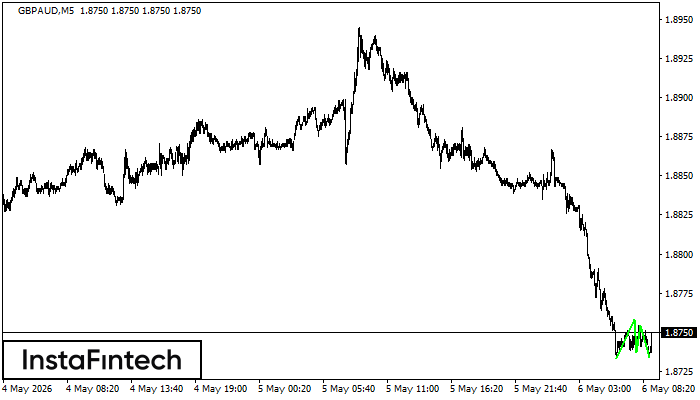
GBPAUD M5
Inverse Head and Shoulder
According to M5, GBPAUD is shaping the technical pattern – the Inverse Head and Shoulder. In case the Neckline 1.8751/1.8752 is broken out, the instrument is likely to move toward 1.8767.
GBPAUD M5
Triple Bottom
The Triple Bottom pattern has been formed on GBPAUD M5. It has the following characteristics: resistance level 1.8758/1.8754; support level 1.8733/1.8734; the width is 25 points. In the event of a breakdown of the resistance level of 1.8758, the price is likely to continue an upward movement at least to 1.8752.
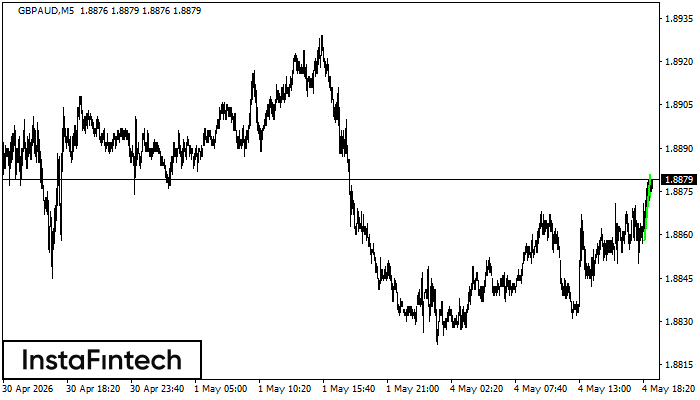
GBPAUD M5
Bullish pennant
The Bullish pennant pattern is formed on the GBPAUD M5 chart. It is a type of the continuation pattern. Supposedly, in case the price is fixed above the pennant’s high of 1.8881, a further uptrend is possible.