 中文
中文  Русский
 English
 Bahasa Indonesia
 Bahasa Malay
 ไทย
ไทย Español
 Deutsch
 Български
 Français
 Tiếng Việt
 বাংলা
বাংলা हिन्दी
 Čeština
 Українська
 Română
FX.co ★ Patterns NZDUSD | New Zealand Dollar (NZD) to US Dollar (USD) Rate in the Forex market

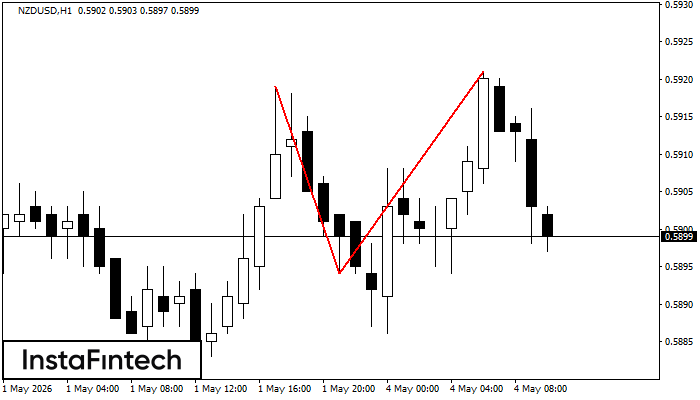
NZDUSD H1
Double Top
The Double Top pattern has been formed on NZDUSD H1. It signals that the trend has been changed from upwards to downwards. Probably, if the base of the pattern 0.5894 is broken, the downward movement will continue.
NZDUSD H1
Double Top
On the chart of NZDUSD H1 the Double Top reversal pattern has been formed. Characteristics: the upper boundary 0.5921; the lower boundary 0.5894; the width of the pattern 27 points. The signal: a break of the lower boundary will cause continuation of the downward trend targeting the 0.5854 level.
NZDUSD M5
Triple Top
On the chart of the NZDUSD M5 trading instrument, the Triple Top pattern that signals a trend change has formed. It is possible that after formation of the third peak, the price will try to break through the resistance level 0.5902, where we advise to open a trading position for sale. Take profit is the projection of the pattern’s width, which is 8 points.
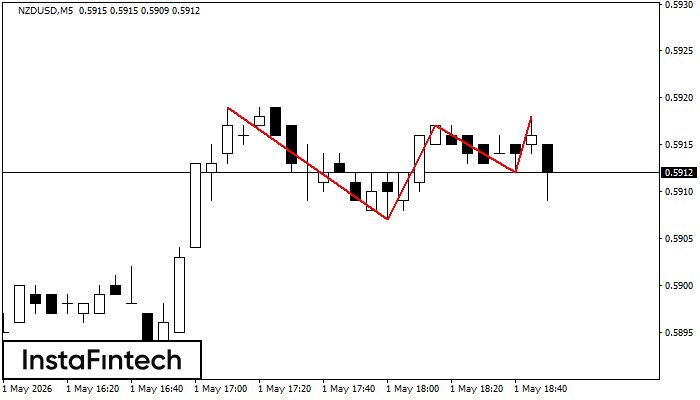
NZDUSD M5
Triple Top
The Triple Top pattern has formed on the chart of the NZDUSD M5 trading instrument. It is a reversal pattern featuring the following characteristics: resistance level 1, support level -5, and pattern’s width 12. Forecast If the price breaks through the support level 0.5907, it is likely to move further down to 0.5902.
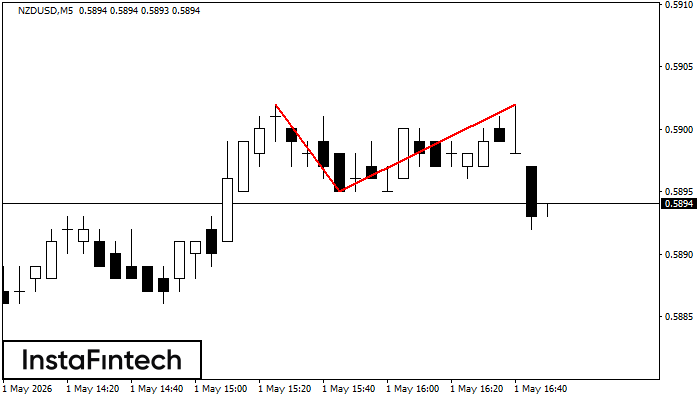
NZDUSD M5
Double Top
On the chart of NZDUSD M5 the Double Top reversal pattern has been formed. Characteristics: the upper boundary 0.5902; the lower boundary 0.5895; the width of the pattern 7 points. The signal: a break of the lower boundary will cause continuation of the downward trend targeting the 0.5880 level.
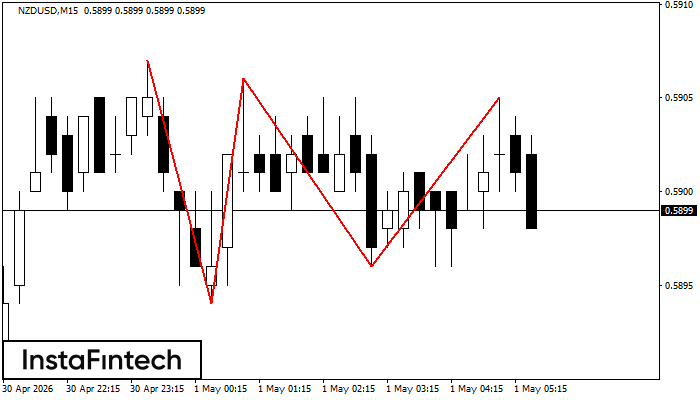
NZDUSD M15
Triple Top
On the chart of the NZDUSD M15 trading instrument, the Triple Top pattern that signals a trend change has formed. It is possible that after formation of the third peak, the price will try to break through the resistance level 0.5894, where we advise to open a trading position for sale. Take profit is the projection of the pattern’s width, which is 13 points.
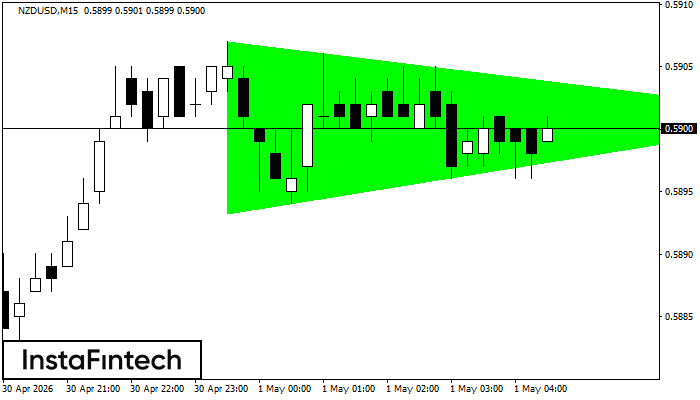
NZDUSD M15
Bullish Symmetrical Triangle
According to the chart of M15, NZDUSD formed the Bullish Symmetrical Triangle pattern. Description: This is the pattern of a trend continuation. 0.5907 and 0.5893 are the coordinates of the upper and lower borders respectively. The pattern width is measured on the chart at 14 pips. Outlook: If the upper border 0.5907 is broken, the price is likely to continue its move by 0.5924.
NZDUSD M5
Double Top
The Double Top pattern has been formed on NZDUSD M5. It signals that the trend has been changed from upwards to downwards. Probably, if the base of the pattern 0.5881 is broken, the downward movement will continue.
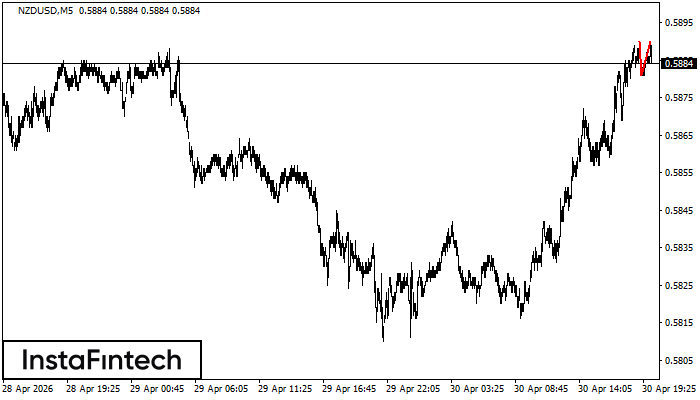
NZDUSD M5
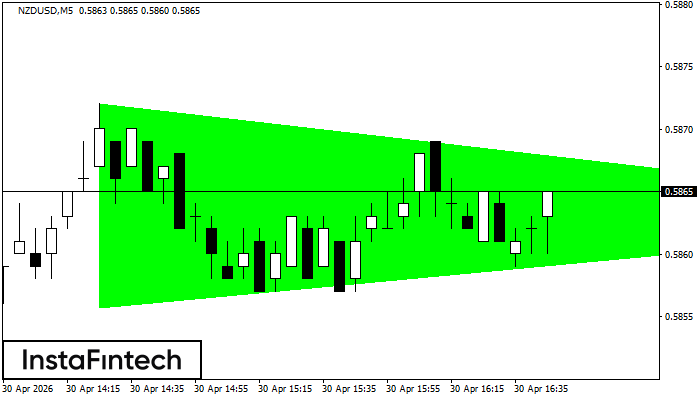
Bullish Symmetrical Triangle
According to the chart of M5, NZDUSD formed the Bullish Symmetrical Triangle pattern. The lower border of the pattern touches the coordinates 0.5856/0.5863 whereas the upper border goes across 0.5872/0.5863. If the Bullish Symmetrical Triangle pattern is in progress, this evidently signals a further upward trend. In other words, in case the scenario comes true, the price of NZDUSD will breach the upper border to head for 0.5878.
NZDUSD M5
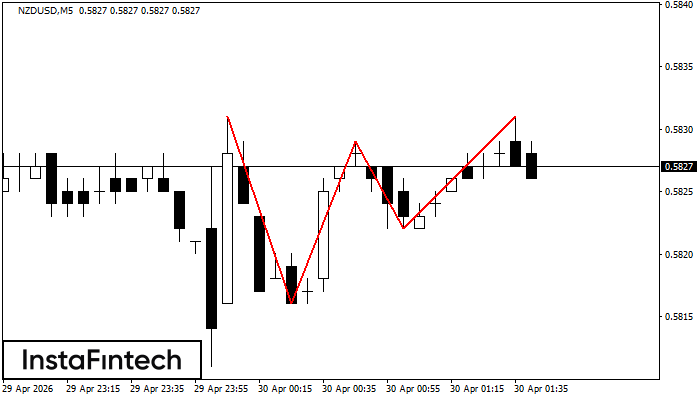
Triple Top
The Triple Top pattern has formed on the chart of the NZDUSD M5 trading instrument. It is a reversal pattern featuring the following characteristics: resistance level 0, support level -6, and pattern’s width 15. Forecast If the price breaks through the support level 0.5816, it is likely to move further down to 0.5814.