 中文
中文  Русский
 English
 Bahasa Indonesia
 Bahasa Malay
 ไทย
ไทย Español
 Deutsch
 Български
 Français
 Tiếng Việt
 বাংলা
বাংলা हिन्दी
 Čeština
 Українська
 Română
FX.co ★ Patterns SILVER | Silver Rate in the Forex market

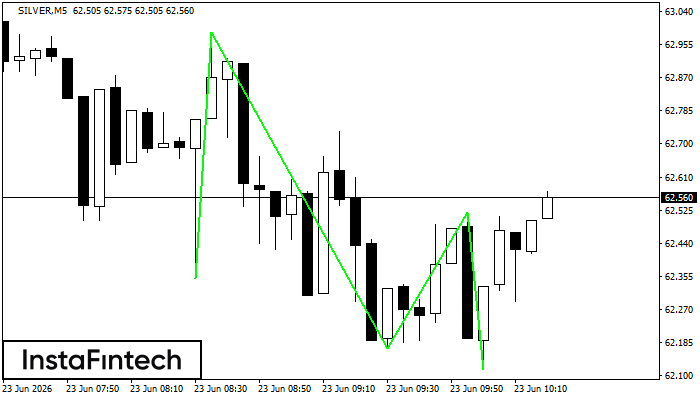
SILVER M5
Triple Bottom
The Triple Bottom pattern has formed on the chart of SILVER M5. Features of the pattern: The lower line of the pattern has coordinates 62.98 with the upper limit 62.98/62.52, the projection of the width is 635 points. The formation of the Triple Bottom pattern most likely indicates a change in the trend from downward to upward. This means that in the event of a breakdown of the resistance level 62.35, the price is most likely to continue the upward movement.
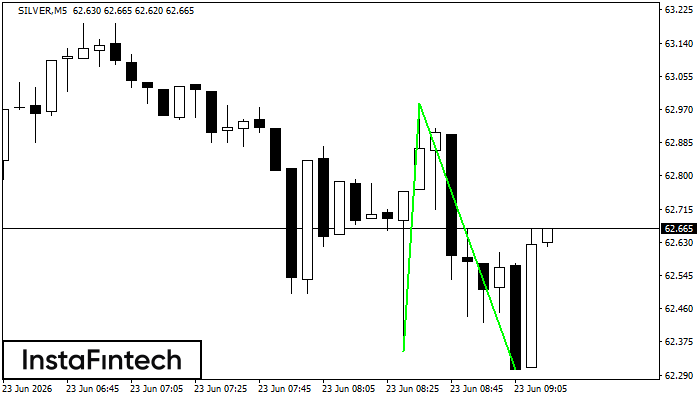
SILVER M5
Double Bottom
The Double Bottom pattern has been formed on SILVER M5. This formation signals a reversal of the trend from downwards to upwards. The signal is that a buy trade should be opened after the upper boundary of the pattern 62.98 is broken. The further movements will rely on the width of the current pattern 635 points.
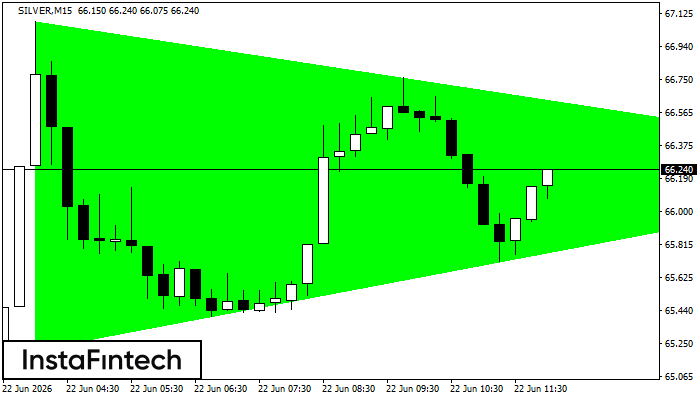
SILVER M15
Bullish Symmetrical Triangle
According to the chart of M15, SILVER formed the Bullish Symmetrical Triangle pattern. Description: This is the pattern of a trend continuation. 67.08 and 65.22 are the coordinates of the upper and lower borders respectively. The pattern width is measured on the chart at 1864 pips. Outlook: If the upper border 67.08 is broken, the price is likely to continue its move by 66.27.
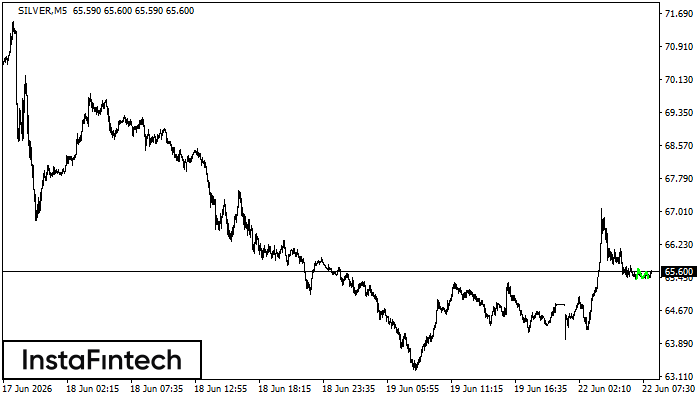
SILVER M5
Triple Bottom
The Triple Bottom pattern has formed on the chart of the SILVER M5 trading instrument. The pattern signals a change in the trend from downwards to upwards in the case of breakdown of 65.65/65.60.
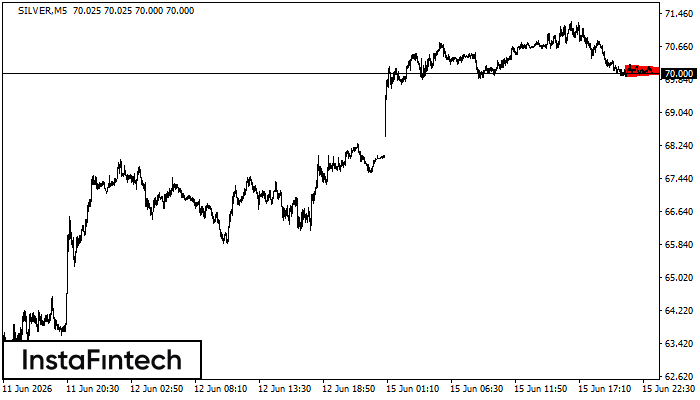
SILVER M5
Triple Top
On the chart of the SILVER M5 trading instrument, the Triple Top pattern that signals a trend change has formed. It is possible that after formation of the third peak, the price will try to break through the resistance level 70.06, where we advise to open a trading position for sale. Take profit is the projection of the pattern’s width, which is 400 points.
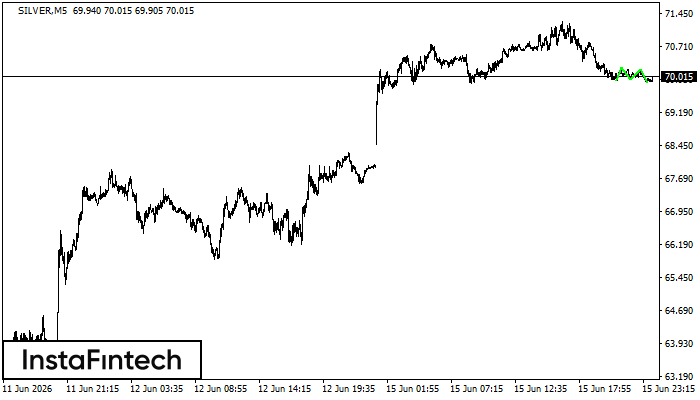
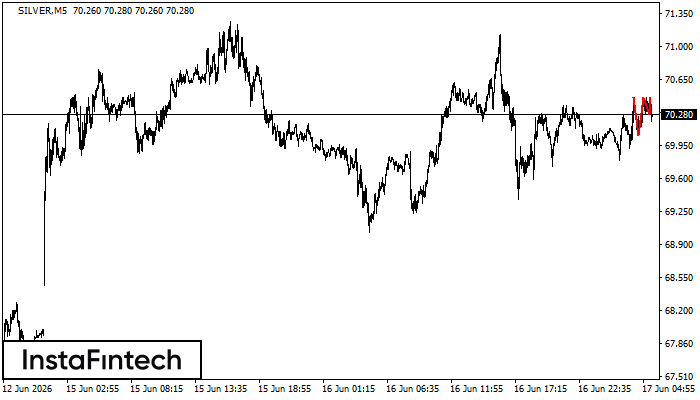
SILVER M5
Triple Bottom
The Triple Bottom pattern has been formed on SILVER M5. It has the following characteristics: resistance level 70.22/70.18; support level 69.92/69.88; the width is 295 points. In the event of a breakdown of the resistance level of 70.22, the price is likely to continue an upward movement at least to 69.96.
SILVER M5
Bearish Symmetrical Triangle
According to the chart of M5, SILVER formed the Bearish Symmetrical Triangle pattern. This pattern signals a further downward trend in case the lower border 69.92 is breached. Here, a hypothetical profit will equal the width of the available pattern that is -304 pips.

SILVER M5
Bearish Rectangle
According to the chart of M5, SILVER formed the Bearish Rectangle which is a pattern of a trend continuation. The pattern is contained within the following borders: lower border 69.92 – 69.92 and upper border 70.22 – 70.22. In case the lower border is broken, the instrument is likely to follow the downward trend.
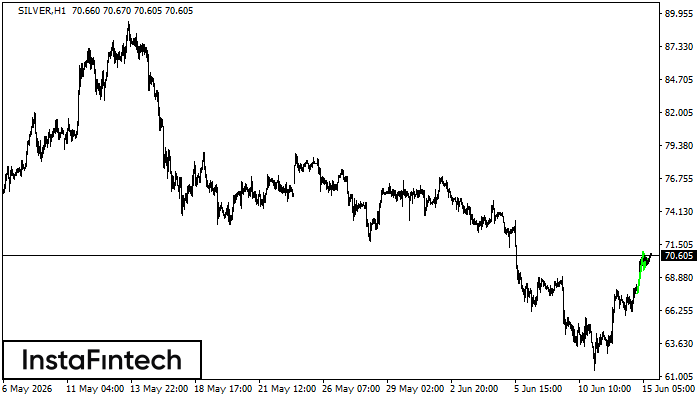
SILVER H1
Bullish pennant
The Bullish pennant signal – Trading instrument SILVER H1, continuation pattern. Forecast: it is possible to set up a buy position above the pattern’s high of 70.97, with the prospect of the next move being a projection of the flagpole height.
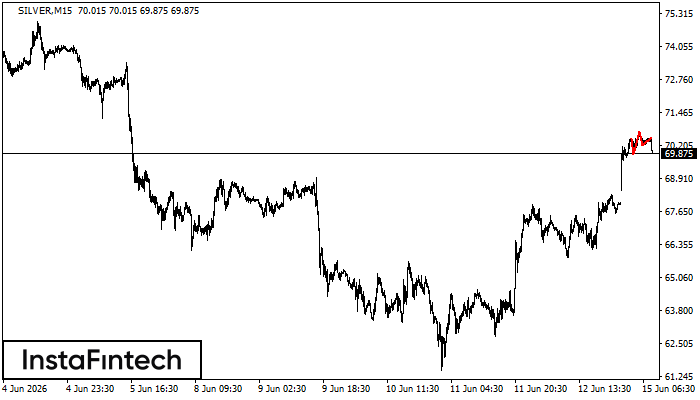
SILVER M15
Triple Top
On the chart of the SILVER M15 trading instrument, the Triple Top pattern that signals a trend change has formed. It is possible that after formation of the third peak, the price will try to break through the resistance level 69.84, where we advise to open a trading position for sale. Take profit is the projection of the pattern’s width, which is 645 points.